
Head-and-shoulders are a chart pattern in which the rate is said to reverse in the opposite direction of the previous trend, and is one of the “reversal patterns,” the same as a double top.
The head and shoulders is a very famous chart pattern in the market world and is also known as the “triple-ceiling” (when it appears at the bottom of the price movement, it is called the inverse triple-ceiling).
In this article, we will explain in detail what head-and-shoulders are, their meaning and origins, and how to trade on head-and-shoulders while looking at the collective psychology of market participants.
- What is Head and Shoulders? Basic Characteristics
- Why such a name in the first place?
- How to trade successfully with head-and-shoulders (triples)?
- Dissecting Group Psychology in a Head-and-Shoulders
- How to Trade with Head and Shoulders
- Meaning of Head and Shoulders and How to Trade – Summary
- Preview of next installment
What is Head and Shoulders? Basic Characteristics
First, we will touch on a handful of head-and-shoulders basics.
Then, we will provide the details in turn.
The head and shoulders are called “head and shoulders” because they look like a “human head and shoulders” on a currency chart.
The head-and-shoulders are made up of three distinctive highs, with the center high being higher than the highs on both sides.
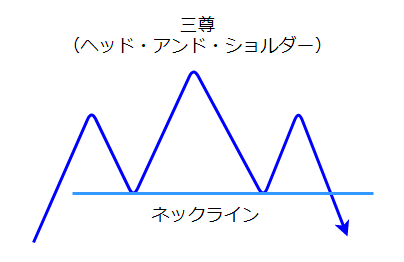
The chart pattern “Head and Shoulders” indicates that the price once made a new high, but fell back to the previous low, and this time fell below the low without making a new high.
This time, the price did not make a new high but fell below the previous low. This created a market consensus (common mood) among market participants that the price would not rise further.
When the price breaks below the neckline, the previous uptrend tends to be considered over (and the price reverses and begins to fall).
Head-and-shoulders are classified as “ceiling patterns” because of their tendency to reverse and fall.
Of course, it is possible for a price to break below the neckline and then rise significantly again.
This is often seen when the time axis above the time axis where the head and shoulders appear is in an uptrend.
For example, a head-and-shoulder may appear on the hourly time frame while the daily time frame is in an uptrend.
Head-and-shoulders also appear in a downtrend and are called “inverse head-and-shoulders” or “head-and-shoulder bottoms.
The characteristics of the price movement in this case are the same as those of the head and shoulders at the ceiling, with the meaning reversed.
Why such a name in the first place?
Head and shoulders is one of the basic patterns of technical analysis.
First of all, let me tell you a little about the origin of its name.
As the saying goes, “The name says it all,” and this pattern is so “exactly what it sounds like.
The highest value in the center is the “head,” and the highest values on the sides are the “shoulders. It is very simple.
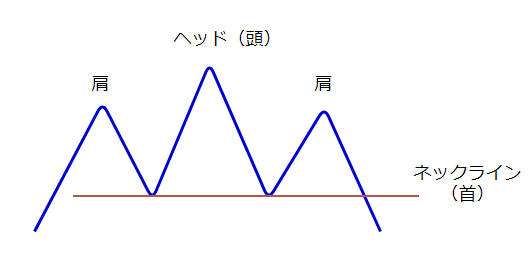
The Japanese name “sanzon-ceiling” probably does not ring a bell for many people when they hear the name.
Incidentally, the origin of the “sanzon-ceiling” is modeled on the “Amida sanzon-ritsu” (three images of Amida) enshrined at Ono Jodoji temple in Ono City, Hyogo Prefecture, which was created by Kakei (a famous Buddhist priest).
The three statues are lined up in a row, with a large statue of Nyorai in the center and Bodhisattvas on either side, and the three statues look just like this pattern.
How to trade successfully with head-and-shoulders (triples)?
As we discussed in detail in the previous article on “Double Top/Double Bottom,” what is important in creating a trading strategy is the major market trend (existence and direction of the trend) and the group psychology that appears in the trend.
Ignoring the market trend and the collective psychology and simply trading mechanically based on chart patterns will not work at all.
What is important when trading with a reversal pattern called “head-and-shoulders” is, as with other reversal patterns, whether the place where the pattern appears is a possible turning point in the chart.
In other words, it is important to correctly understand the circumstances under which the pattern appeared, and furthermore, it is necessary to consider how the collective psychology works.
I discussed this in detail in my previous article on “double tops and double bottoms.
This is a very important part of technical analysis, so if you have not read the previous article, please start there.

Dissecting Group Psychology in a Head-and-Shoulders
From here, we will follow the process of the formation of the head-and-shoulders and look at the group psychology that is manifested in the process.
The figure below shows an uptrend, with red lines drawn at the lows.
The rate has just started to reverse down from its high.
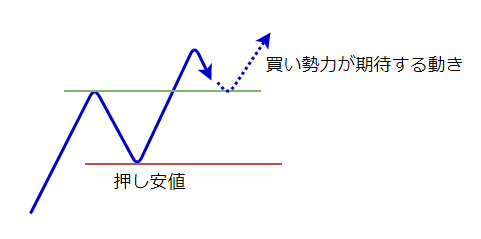
At this stage, traders with buy positions (the buying forces) are hoping that the trend will still continue.
Traders with buy positions are hoping that the green line will become a support line and that the price will rise again (expectation of a roll reversal).
The collective psychology is, “We’re in a raving uptrend!” and in a nutshell, we are in a state of expecting further gains.
Clouds are getting darker, but still assuming a buy scenario
The rate did not stop at the green support line, but went below it.
The falling rate went straight to the “push low” on the red line, where it rebounded.
At this point, the push-low line became known as the “neckline,” and it is around this point that discerning market participants begin to become aware of the head-and-shoulders.
Traders who are planning to buy must be nervous in the face of this situation.
The clouds are getting a bit thicker, even though they were so happy about the continuation of the trend just a few minutes ago.
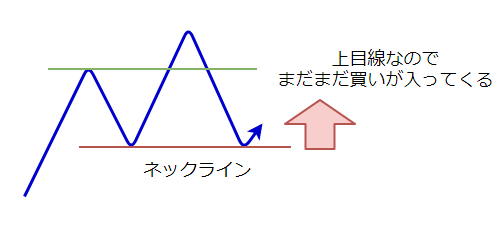
However, the uptrend has not yet broken below the low, so the uptrend has not been negated. The uptrend is still upward, and the collective sentiment is “We’ve got a long way to go! The mood is It’s not over yet!”
If you are wondering, “What do I mean by the definition of a trend or an uptrend? then please read the following article to understand the definition of trend and how to define the line of sight.
Near push lows are also entry opportunities
In fact, there are many traders who decide that this is a good time to take a buy position.
This is because it is also an opportunity to take a position with a narrow stop-loss margin by placing a stop-loss order below the push-low.
As you can see in the chart, this type of reaction can be seen at least once when the exchange rate is close to a push-low/reversal high.
The collective mindset of the buying forces that have been watching the rate reverse at the push-low begins to hope that the rate will continue to make new highs.
A sharp turnaround and a big pinch is coming
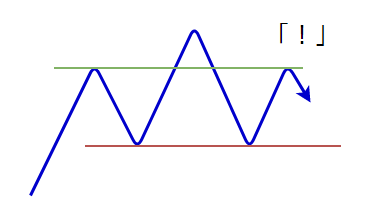
However, instead of breaking to a new high, the price reversed long before that point and showed a downward price movement to a lower high.
The buying forces saw this and suddenly became impatient.
In addition to the rate falling to a push-low, this time the price movement failed to make a new high.
Even if you thought that the uptrend was still continuing (i.e., the upward trend) when the price fell to the push-low, this kind of price movement makes it difficult to be optimistic.
In terms of collective psychology, the buying forces will be looking at the market with considerable anxiety.
Incidentally, a selling trader who sees this “cutback of the high price” and decides that the price will not go up again will enter the market. In other words, it is at this timing that the quick-witted traders who think a head-and-shoulders may be formed take action.
You may be tempted to enter at this time, and I do not deny that trade, but you need to understand that it is an aggressive risk appetite in a still uptrend (upside).
In other words, the possibility of another higher high is still in play.
Head-and-shoulders nearing completion
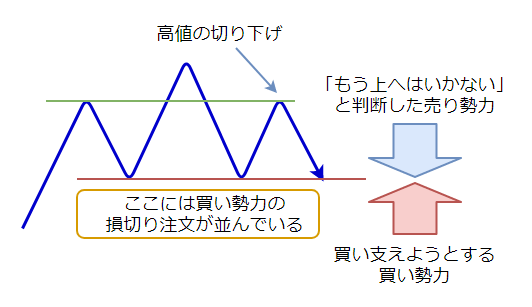
And the rate has finally reached the push low (neckline) again.
The buying forces are already on edge.
It is clear that there is a line of “stop-loss orders for buy positions” below the neckline.
Therefore, traders who are in the buying force are very much afraid of a break below the neckline and a loss.
In addition, traders with selling power, who have seen the “cut-off of the highs” and have decided that the price will not go higher, have also begun to participate in the market.
This means that a fierce battle between the buyers and sellers could begin.
As a result, the chart may look like the one below.
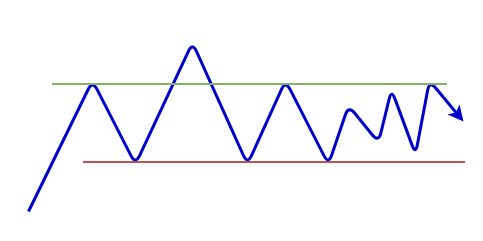
This is a case in which a huge battle between buyers and sellers breaks out above the neckline.
In this case, we can no longer call it a “head-and-shoulders” market, and we should either wait and see, or redefine our trading strategy as a range market based on the situation on a larger time chart.
And then it’s settled, and it’s going to be a big move
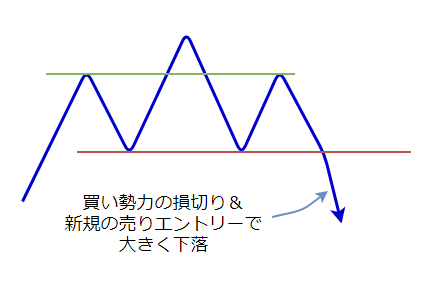
When the neckline is breached, the buyers’ stop-loss orders (i.e., sell orders to settle) are finally executed like an avalanche, and the rate begins to fall.
In terms of the collective psychology, traders with buy positions are in a state of panic and either try to escape first or freeze in fear, resulting in large unrealized losses.
Then, taking advantage of the confusion, courageous sell traders enter the market with new sell orders.
How to Trade with Head and Shoulders
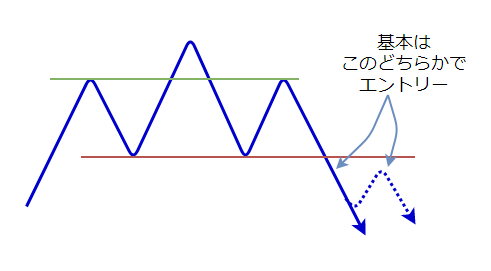
The basic rule of thumb for trading on the head and shoulders is to enter at this “neckline breakout” point.
As a safeguard, it is recommended to enter at the point where the price comes back further and reverses down near the neckline.
However, a decline from a head-and-shoulders formation tends to move all at once like an avalanche. Therefore, it is a legitimate trade to adjust the stop-loss range and position size, and jump in at the timing of the breakout of the line.
The breakout of the neckline often does not follow a straightforward pattern (a return in an N-shaped pattern) because of the intense buying and selling.
Therefore, it is necessary to use different methods depending on the situation, such as aggressive trading immediately after the breakout, or entering the market on the back of some evidence (local firings or double tops) while checking the status of the return.
We will provide more information on this area in another article.
Meaning of Head and Shoulders and How to Trade – Summary
So far, we have discussed the head-and-shoulders, one of the basic patterns of technical analysis, focusing on its collective psychological changes, and explained the process of pattern formation and how to trade within it.
As with double tops and double bottoms, what was important here was the existence of a push low (return high).
In the head-and-shoulders, in particular, the push-low line becomes the neckline, which naturally increases its importance.
Head-and-shoulders are also important in the larger time frame situation
And don’t forget, the status of the larger hourly chart.
Specifically, the position of the support and resistance lines on the larger time frame and the state of the trend on the larger time frame.
Head-and-shoulders are also reversal patterns, so if a pattern appears on a smaller time frame when it is clear from the larger time frame that a reversal is in order, the reliability of the pattern will increase.
The advantages of identifying group psychology
The most important thing is to read changes in the collective psychology from the charts.
By looking at the charts with an eye to which lines the market participants are anxious or fearful when they break through, you will be able to calmly turn the move into a profit when everyone is emotionally moving in one direction or the other.
Head-and-shoulders come in all shapes and sizes, but they all have something in common in terms of group psychology.
Therefore, by looking at head and shoulders with the following awareness, you will be able to apply them more and more.
- How do traders feel when they see a devalued high or low?
- Who will be in trouble if we break out of those lines?
The above is the meaning of the head-and-shoulders (triad ceiling) and how to trade it.
Related FXのチャートパターン関連用語の意味と解説まとめ
If you have not read the Double Top/Bottom article, please take this opportunity to do so. By reading them together, you will have a better understanding of Head and Shoulders.
Preview of next installment
In the next article, the third part of the chart patterns will cover the patterns seen in a range market and will explain in detail the meaning of the patterns seen there and how to trade them.
Please click on the link below.

We also recommend this article