FXにおける『優位性』とは、今の相場状況において「買いと売りのどちらかに確率的(統計的)に有意な偏り」があることを示す言葉です。
また、トレード手法がもつ「利益を生み出す力」を意味する言葉としても使われます。
例えば「今の相場状況には買いの優位性がある」「売りと買いのどちらにも優位性がない」「このトレード手法には高い優位性がある」という風に用いられます。
ちなみにFXでの優位性は「エッジ」とも呼ばれています。
この記事では、優位性を活かしたトレード手法の具体例を紹介しながら、FXの世界における優位性(エッジ)について詳しく解説していきます。
「まずはトレード手法を見てみたい」という場合は、『優位性を積み重ねたトレード手法の具体例』からご覧ください。
FXの優位性(エッジ)にはいくつかの意味がある
FXトレードの世界では、優位性(エッジ)はいくつかの意味で使われています。
まず「優位性のあるトレード手法」といった場合は、その取引手法でトレードを繰り返すとトータルで利益を出すことが出来る、優れたトレード手法であることを表します。
また、「優位性のある相場状況」といった場合は、為替相場のある特定のチャート状況において、売りと買いそれぞれの勢力がアンバランスになって(売買が偏って)、確率的にどちらか一方が有利になっている相場局面のことを指します。
別の表現として「優位性が発生している相場状況」という言い方も出来ます。
この「優位性のある相場状況」においては、為替レートの動きの傾向を確率的(統計的)に予測できるので、「この相場状況では買いポジションを持つことが確率的に有利なトレードだ」といった判断を導き出すことが可能になります。
つまり「優位性のある相場状況」について確率的に明確化した上で、エントリーと決済のトレード判断を総合してルール化したものが「優位性のあるトレード手法」ということになります。
トレーダー自身にも優位性の優劣がある
FXの優位性を考える上で忘れられがちで、かつ非常に重要な要素が『トレーダー自身の優位性』です。
FXトレードでは、使用するトレード手法にいくら高い優位性があったとしても、それを用いるトレーダー自身(つまり“あなた”)に優位性が無いと、トレード手法の優位性を活かすことが出来ません。
トレーダーの優位性としては、主に次のようなものが挙げられます。
- トレードルール通りにチャート分析を行い、売買注文を正確に執行できるスキル。
- 冷静に損切りを執行したり、損切りした後でも次のエントリーチャンスで躊躇なく再エントリーできる、メンタル面の安定性。
- 自分のトレード手法に優位性があるか(手法の優位性が低下していないか)を検証できるスキル。
こうしたスキルやメンタルの安定性を持っているFXトレーダーは、他のトレーダーよりも優れた特質を持っているということであり、トレード結果に好ましい影響を及ぼします。
つまり「他のトレーダーと比べて優位性がある」ということになります。
トレーダー自身に高い優位性があると、トレード手法自体の優位性があまり優れていなかったとしても、トータル成績ではそれなりの利益を上げることが可能になったりもします。
例えば、多くのFXトレーダーにとって困難を感じるトレード手法である「極めて低勝率の損小利大トレード」を用いた場合でも、安定したメンタルを背景に淡々とエントリーと損切りを繰り返して、トータルプラスの成績を上げられるでしょう。
これはトレーダー自身の高い優位性のなせる業(わざ)だと言えます。
FXでの基本的な「優位性のある相場状況」について

ここからは、優位性のある相場状況──つまり買い勢力と売り勢力のバランスに偏りが生じ、どちらか一方が確率的に有利になっている相場状況と、その状況を実際にトレードで活用する方法について、具体的に見ていきましょう。
水平線のブレイクアウトは、優位性が生まれる基本的な相場状況
優位性が生じている「典型的かつ基本的な相場状況」は、水平線(サポートラインとレジスタンスライン)をブレイクアウトする場面です。
例えば、サポートラインを下落方向へブレイクアウトしていく状況は、売りの勢力が強くなっているため、この状況下では基本的に売りポジションを持つのが、優位性に則ったFXトレードのセオリーです。
当たり前のことのように聞こえるかもしれませんが、このシンプルさが優位性を考えるときには大切ですし、その最初の一歩として水平線での値動きをシンプルに捉えることは、とても有効なアプローチといえます。
多くのFXトレーダーは値動きを難しく考え過ぎてしまい、最初の一歩すら踏み出せず、検証作業がままならない状態に陥っています。
まずはシンプルに、基本的な要素について掘り下げて見ていくようにしましょう。
水平線(サポート&レジスタンスライン)の原理に注目する
ラインをブレイクアウトすると、ブレイク方向への一方的な値動きが一時的に発生します。
例えばサポートラインを下落方向へブレイクアウトしていく場面では、以下のような理由で買い注文が少なくなる結果、売りと買いのバランスに偏りが生まれます。
- 買い勢力の損切りである「決済の売り注文」がドミノ倒しのように起こりやすく、為替レートが下落していきやすい。
- 勝ち馬に乗ろうとする「新規の売り注文」が一時的に殺到しやすい。
- 勢いよく下落する様子を目の当たりにした相場参加者の間で「新規の買い注文」を控えるムード(相場の心理・雰囲気)が生じる。
このような理由から、水平線をブレイクアウトする際の値動きには優位性があると考えられるのです。
もし水平線(ライン)の理解に不安がある場合は、下の記事を参考にして下さい。
解説記事 『サポートライン・レジスタンスライン』とは?引き方、使い方、機能する理由
「複数の優位性を積み重ねる」トレード手法の作り方
とはいえ当然、水平線のブレイクアウトだけのトレード手法ではFXで勝つことは困難です。
単純に「移動平均線の上でロング、下でショート」というトレードを繰り返しても、トータルでは勝つことが出来ないのと同様、大雑把な水平線のブレイクアウトだけで利益を出せるほどFXは甘い世界ではありません。
そこで大切になってくるのは、トレード手法を作る際に「優位性を積み重ねる(組み合わせる)」ことです。
優位性を組み合わせる際の分かりやすいアプローチとしては、「トレンドと同調する方向に現れる優位性」を積み重ねるという方法が挙げられます。
具体的には、以下のような優位性を複数積み重ねる方法が考えられます。
- ダウ理論に則った「高値と安値の切り上げ・切り下げ」の方向に従う優位性。
- チャートパターンをブレイクアウトする優位性。
- プライスアクションの優位性。
- インジケーター(テクニカル指標)の優位性。
以下、それぞれの優位性について説明していきます。
「高値と安値の切り上げ・切り下げ」の方向に従う優位性
一般的に「高値と安値が切り上がっている相場状況」は、買いポジションを持つことに優位性があるとされている状況です。
その理由は、高値が更新されていて、なおかつ直近の安値が前回安値よりも上回っているということは、売り勢力よりも買い勢力の方が強いことを表しているからです。
為替レートは、前回安値まで下落する手前で上昇傾向を見せ始めます(買い圧力による上昇)。
これは、売られても売られても前回安値よりも高いレートで「買いたい」というトレーダーが大勢現れるということであり、相場のムードとして「安いレートで買いたいけれど、上昇してしまう前に買っておきたい」という意識が働きやすい状況になっていると考えられるのです。
もし売り勢力も同様に強い(売りと買いが均衡している)のであれば、高値が何度も更新されることは無く、安値も維持されたり、下抜けて更新されたりするはずです。
しかしそうならず、高値も安値も上昇傾向を見せている(切り上げている)ということは、現状において買いが有利だということです。
チャートパターンをブレイクアウトする優位性
シンプルなレンジをはじめ、三角保ち合いやフラッグ(トレンドライン)などのチャートパターンをブレイクアウトしていく相場状況は、水平線のブレイクアウト同様、優位性が生まれている状況と考えられます。
レンジの上限下限については言うまでもなく、三角保ち合い(アセンディング&ディセンディング・トライアングル)やフラッグの上限と下限も、レジスタンスラインやサポートラインとして機能しやすい傾向があります。
ですので、これらチャートパターンをブレイクアウトする状況でも優位性(売りと買いの勢力の偏り)が生じていると言えます。
プライスアクションの優位性
プライスアクションとは、ローソク足の値動きそのもののことで、一本のローソク足によるプライスアクションや、複数本のローソク足の組み合わせによるプライスアクションがあります。
有名なプライスアクションの例として、「ピンバー」や「大陽線・大陰線」「明けの明星・宵の明星」といったものがあります。
また、特徴的かつ有益なプライスアクションとして「ダマシ」を表したものが挙げられます。
ダマシの例として、水平線をまたぐように現れた「ピンバー」は、ラインのブレイクアウトが失敗した(ダマシのブレイクアウトになった)可能性を示唆するものとして重要視されます。
そのピンバーとよく似たプライスアクションとして、ブレイクアウトの勢い(ローソク足の長さや本数の程度)よりも強く反転して戻してきた値動きも、ダマシに該当します。
プライスアクションには、そうしたローソク足が形成されるに至った売買の背景があり、そこに「売りと買いの勢力の偏り」が示されているため、優位性のひとつとして活用することが可能です。
インジケーター(テクニカル指標)の優位性
移動平均線やRSI、ストキャスティクス、MACDといったインジケーター(テクニカル指標)には、それ単体自体には特筆すべき優位性は見られないとされています。
ですが、知名度が高く、FXトレーダーの利用率が高いインジケーターが明確なサインを出す状況には、無視できない値動きの傾向があると考えられます。
例えば、200期間の単純移動平均線は多くの注目を集めるポピュラーなインジケーターですので、ブルベア位置による買い圧力や売り圧力の判断、移動平均線のサポート・レジスタンスラインとしての働きなど、何らかの影響が発生する可能性をはらんでいます。
同様に、初期設定値の状態のMACDも、多くのFXトレーダーに利用されている有名インジケーターといえますので、MACDラインの方向やシグナルラインとのクロスといったサイン発生の状況が、ポジティブにもネガティブ(ダマシの発生)にも影響する可能性があります。
このように、他の優位性と組み合わせてインジケーターを用いることで、トレード手法の優位性を補強できる可能性があります。
これらの優位性を積み重ねて一つの手法としてまとめる方法
こうした優位性をまとめる軸としておすすめな優位性は、高値と安値の切り上げ・切り下げの方向(=トレンド方向)です。
つまり、トレンド方向へとチャートパターンがブレイクアウトする相場状況だけを選択し、そのブレイクアウト方向に伴うプライスアクションが現れ、かつインジケーターがブレイクアウト方向へのサインを出している場面でトレードするということです。
このように状況を特定&限定した上で、複数の優位性が生じるタイミングが重なる場面を絞り込んでいくことで、価値のあるトレード手法を見出すことが可能になってきます。
優位性を積み重ねることによって、それぞれ単体では小さく不安定だった優位性が相互補完的に補強され、確率的に有利なポジションを持ちやすくなるという訳です。
優位性を積み重ねたトレード手法の具体例

ここからは、今まで解説してきた優位性を使った「FXトレード手法の実例」をご覧頂きます(なお、決済ルールや資金管理ルールは割愛しています)。
このFX手法で用いている優位性は、主に水平線(サポートラインとレジスタンスライン)に関するものです。
手法の特徴は、大きなトレンドが再開しようとする値動きの圧力を背にする形で、複数のラインにサポートされながら「反対方向へレートが動き難い状況」でポジションを持つように構成されている点です。
あと、既述の通りに、FXトレーダー自身の優位性の有無も重要なファクターだということを、くれぐれも忘れないようにして下さい。
セットアップのルール~優位性を積み重ねる
この手法のセットアップは以下の通りで、これらの条件がすべて満たされていることを確認した上でトリガールールの適用へ進みます。
- 以下の条件がすべて満たされていること(以下の条件は買いの場合。売りはこの逆)。
- トレードする時間足よりも上位の時間足チャートで、明確な上昇トレンドが発生している(高値と安値が切り上がっている)。
- トレードする時間足チャート(以下同じ)でレンジ相場もしくは上昇トライアングルになっている(=明確なレジスタンスラインが形成されている)。
- 上位時間足のトレンド方向へブレイクアウトしつつある(レンジ上限のレジスタンスライン上で攻防している)。
- レジスタンスラインがロールリバーサルしてサポートになっているか、もしくはラインに絡む(またぐ)形で「小さなレンジ(ローソク足10本程度以上)」が形成された。
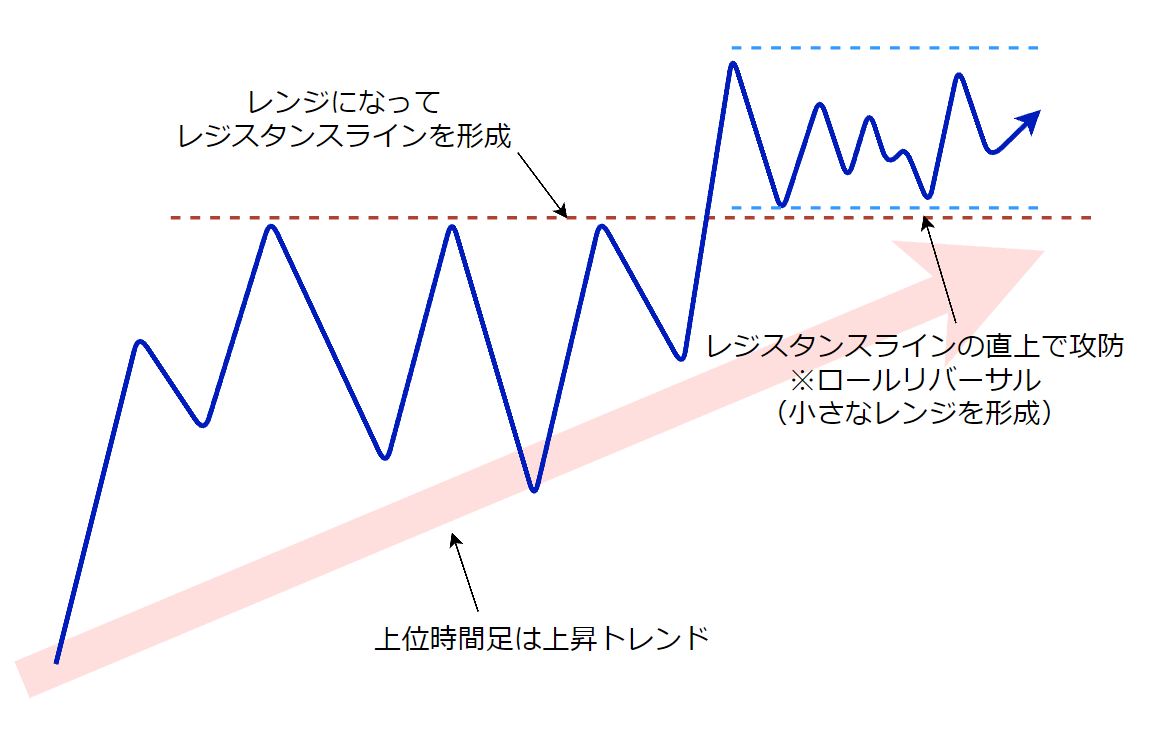
セットアップ条件が満たされた状態(優位性が積み重なった状態)を図式化したものが、以下の図になります。
下の図では、レジスタンスラインがロールリバーサルしてサポートになっている状況下で「小さなレンジ」が形成されているケースを示しています。
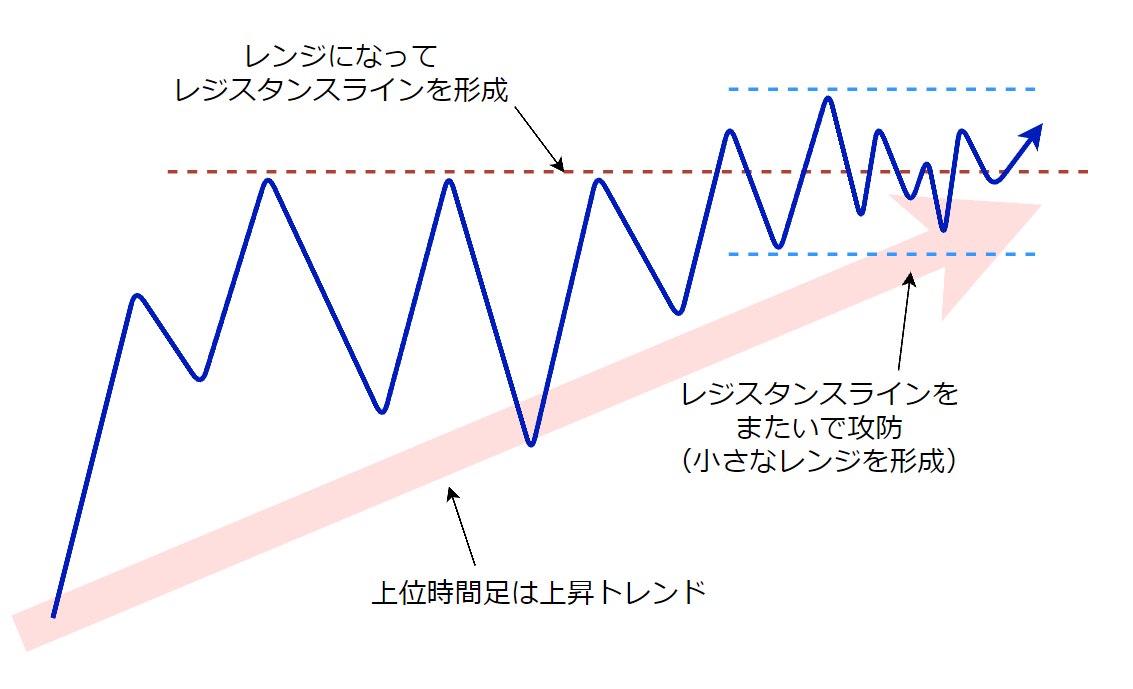
続いての図では、レジスタンスラインを抜け切らない状態で(ラインに絡んで)「小さなレンジ」を形成したケースを示しています。
トリガーのルール~エントリータイミングを計る
セットアップの条件が満たされ、優位性のある相場状況だということが判断できたら、次はトリガーの条件が満たされたタイミングでエントリーを執行します。
下の図は、先程のセットアップの図の「小さなレンジを形成」と示された部分を拡大したものです。
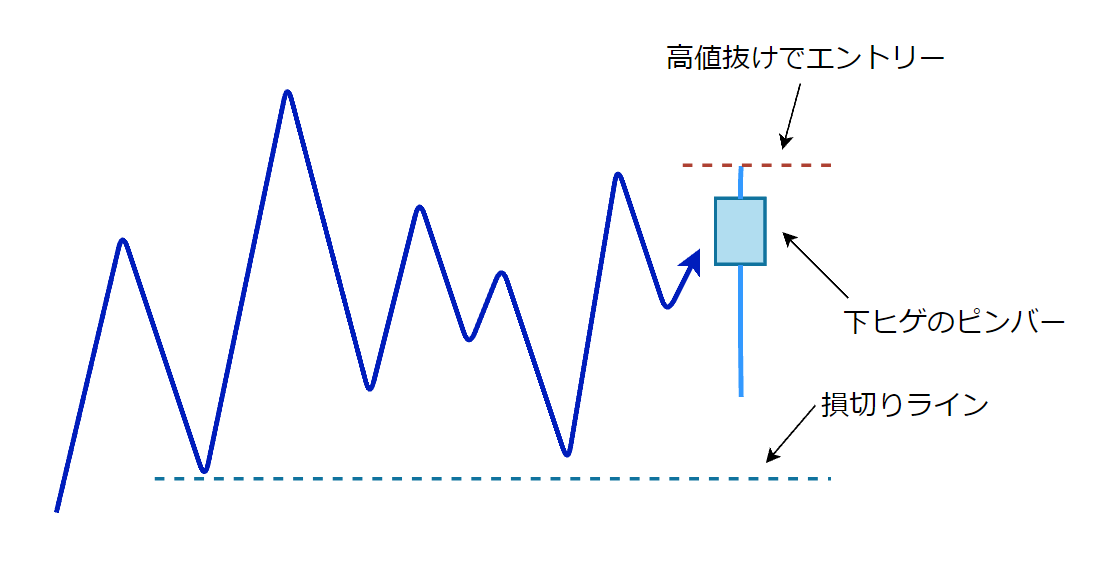
この手法のトリガールール(損切りルールを含む)は以下の通りで、このルールでは「ローソク足の実体が明らか小さくヒゲが長いピンバー」の高値を抜けたら買いエントリーとなります(売りはこの逆)。
このトリガールールで用いている優位性は、ローソク足のヒゲが示すプライスアクションから得ています。
例えば「下ヒゲ」は、強い勢いで押し下げられたものの、それを上回る力で押し戻されたことを示しており、短期的に売り勢力が不利になっている──つまり売買の偏りが生じる可能性があります。
このような短期的な優位性を背景にしたのが、このトリガールールです。
- 「小さなレンジ」の中で、明確な「下ヒゲのピンバー」が現れた。
- ピンバーのヒゲはローソク足の実体の3倍以上の長さが理想であり、ピンバー全体の長さ(値幅)は直近のローソク足群の平均を上回っていることが望ましい。
- その下ヒゲのピンバーの高値を抜けたらエントリー。
- 直後のローソク足でピンバーの高値を抜けなくても、小さなレンジ内での値動きの中でピンバーの高値を抜けたらエントリーして構わない。
- 損切りラインは「小さなレンジの中の最安値の下抜け」。
- 損切り後、再び「小さなレンジ」が形成されたら、トリガーを適用して再エントリーすることが可能(ただし再エントリーは1回まで)。
利益確定の決済ルールについては、以下のような方法が挙げられますが、今回は詳細は割愛します。
- 今回のブレイクアウトの前提となったレンジの値幅を目標レートとする(値動きはN字状に波を描くという前提から)。
- リスクリワード比で目標レートを決める(「損切りまでの値幅のn倍」とする)。
- 上位時間足の直近高安値を目標レートとする(リスクリワード比が1以上を確保できない場合は見送り)。
決済ルールは、各自のトレードスタイルやリスク許容度によって調整が必要な部分ですので、慎重な検証と練習を通じて、ルール全体のバランスを考慮しながら判断していく必要があります。
決済ルールの設定とその適用が不十分だと、ここまで積み重ねてきた優位性を活かすことが出来ず、場合によっては逆効果になってしまう可能性もあるので気を付けましょう。
実際のチャートでの解説
では、ここからは実際のチャート上で、この手法が適用される相場状況を具体的に追っていきながら、優位性が生じる様子を見ていきましょう。
今回使用した過去チャートは、ドル円とユーロドルの5分足および15分足チャートです。
取り上げたチャートは、どれもセットアップルールの条件を満たして優位性が積み重なった状態になっていますので、あなたの目で一つずつ確認していって下さい。
ケース1「理想的な買いのパターン」
下のチャートは、綺麗に高値がそろったレジスタンスラインが形成された後、ラインをまたぐように「小さなレンジ」が形成され、その小さなレンジの下限で下ヒゲのピンバーが現れたケースです。
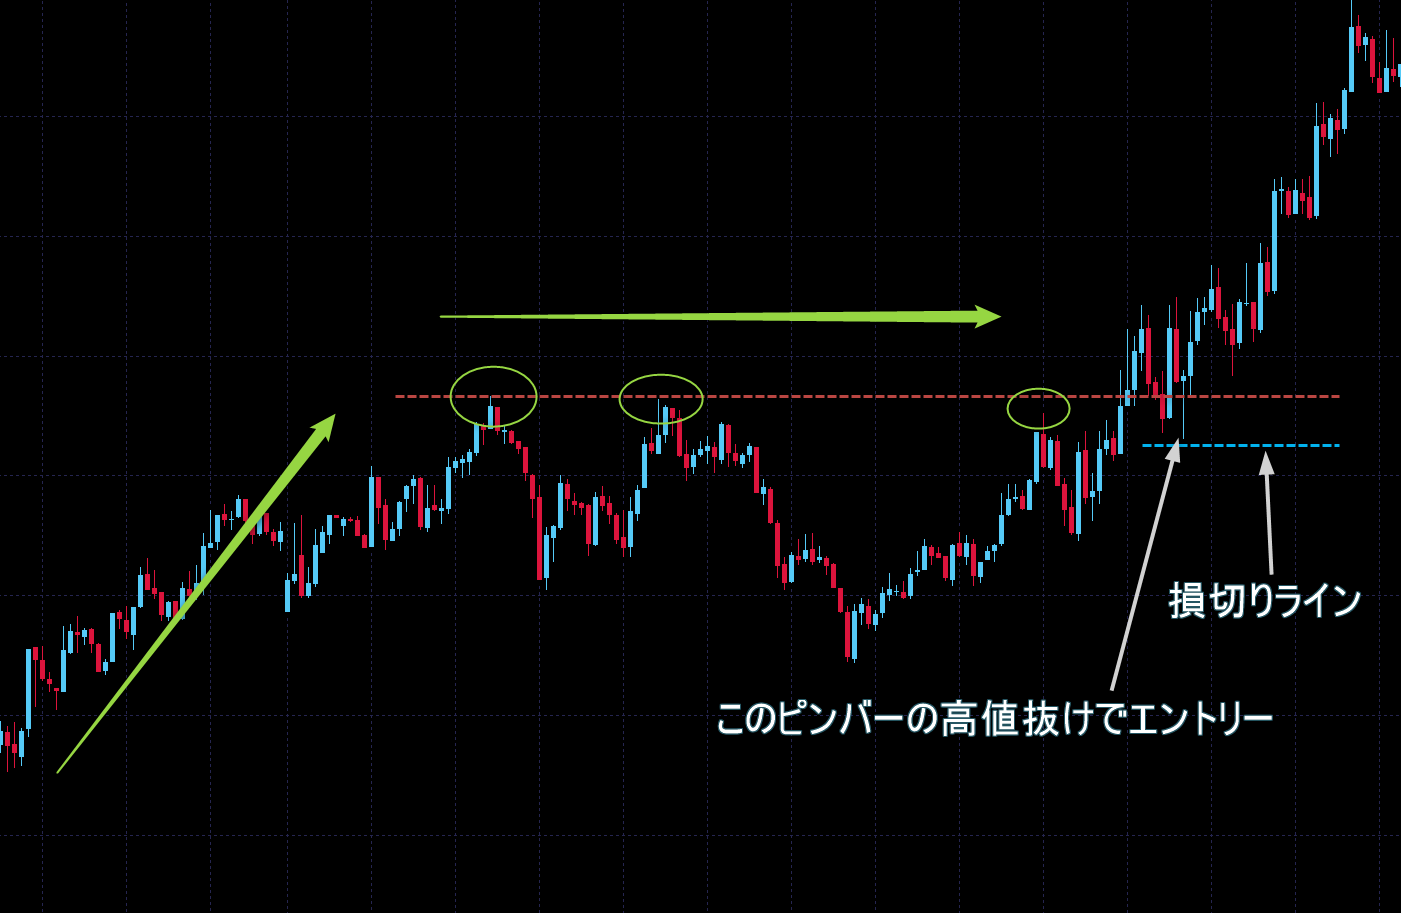
上位の時間足では上昇トレンドであり、現状ではそのトレンドが一服している状態になっています。
売り勢力は何度も押し下げましたが、そのたびに同じ高値まで戻されており、直近では安値はコンスタントに切り上がっていて、売り勢力が劣勢になっている様子が伺えます。
そしてついにレジスタンスラインを上抜けて「小さなレンジ」が形成されるに至りました。
この時点で、売り勢力はレジスタンスラインを守る力を失いつつあり、直近では小さなレンジの高値を防衛ラインにして戦っている状況です。
しばらく停滞したものの、下ヒゲのピンバーが現れます。
これは、売り勢力による押し下げが、買い勢力によってあっけなく否定されたことを表しており、現時点ではこれ以上下げるパワーが売り勢力側には無い可能性が出てきます。
この時点で、以下の優位性が積み重なったことになります。
- 上位足のトレンド方向を背景にしている(常にトレンド再開を期待した買い勢力が参入して来やすい)という優位性。
- 何度も意識され抵抗があったレジスタンスラインを上抜けた(「売りの決済買い」や「新規買い」の注文が増え始める=買い圧力が高まる)という優位性。
- レジスタンスラインがロールリバーサルしてサポートになっている(再びレンジに戻る確率が下がり始めている)という優位性。
- レンジ上限を背に「小さなレンジ」を形成し、そこから下がらなくなってきた(元のレンジ内に押し下げるパワーがさらに減少してきたことを示す)という優位性。
- 「小さなレンジ」内での攻防で「下げを否定するサイン」であるピンバーが現れた(直近で下落する確率はさらに下がった)という優位性。
このような優位性が積み重なった状況──つまり「そこからレートが下がっていく可能性は小さい」と考えられる状況で、いよいよ買いポジションを持つことになります。
エントリーのトリガーとなるピンバーは、レジスタンスラインを終値で抜けて9本目のローソク足で現れており、これはエントリータイミングとしては最も早いケースとなります(今回の手法においては、これ以上早いタイミングでのエントリーは推奨していません)。
損切りまでの値幅が必然的に狭くなるため、損小利大の決済をしやすい状況であり、小さなレンジの位置と形状的にも理想的なパターンだといえます。
ケース2「小さなレンジが深めに押したケース」
下のチャートは、レジスタンスラインをまたいで形成された小さなレンジが、元のレンジの下限に迫るほど深く押してきたケースです。
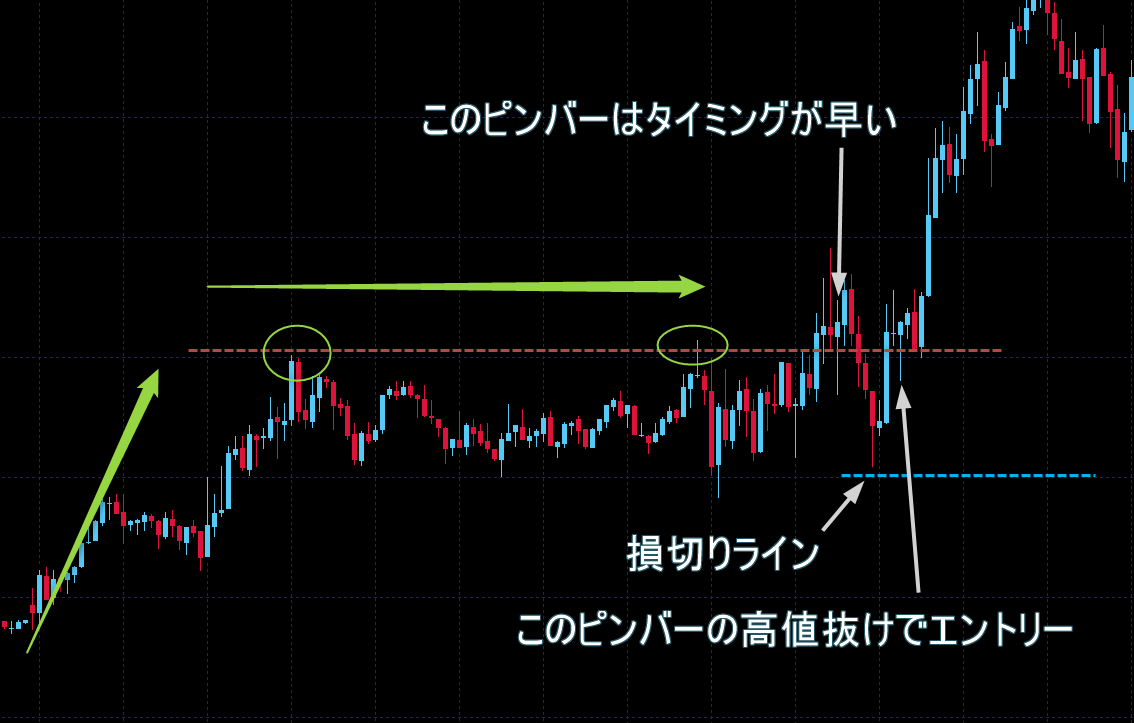
この場合でもセットアップが整って優位性が積み重なるのを待って、トリガーとなるピンバーが現れたら高値抜けでエントリーします。
小さなレンジの値幅が広くなった都合上、損切りまでの値幅も広くなるため、利益確定ルールによってはリスクリワード比に注意を払う必要が出てくるパターンです。
レジスタンスラインを終値で抜けて3本目に現れたピンバーは、ルール的に早過ぎるためスルーします。
仮にこのピンバーの高値抜けでエントリーしていた場合、損切りラインはこのピンバーの安値ということになりますので(この段階では「小さなレンジ」の下限として扱える安値はピンバーの安値のみのため)、結果は損切り決済になります。
セットアップルールの中で、小さなレンジの構成要件として「ローソク足10本程度以上」と指定しているのは、このような「然るべき押しや戻しの値動き」を見届ける意味合いが含まれています。
ケースバイケースではありますが、概ね「後出しジャンケン」になるようなエントリーは優位性的に好ましい傾向が見られます。
ケース3「エントリーのピンバーが巨大なケース」
下のチャートでは、トリガーとなるピンバーが巨大なローソク足になった、例外的なケースを示しています。
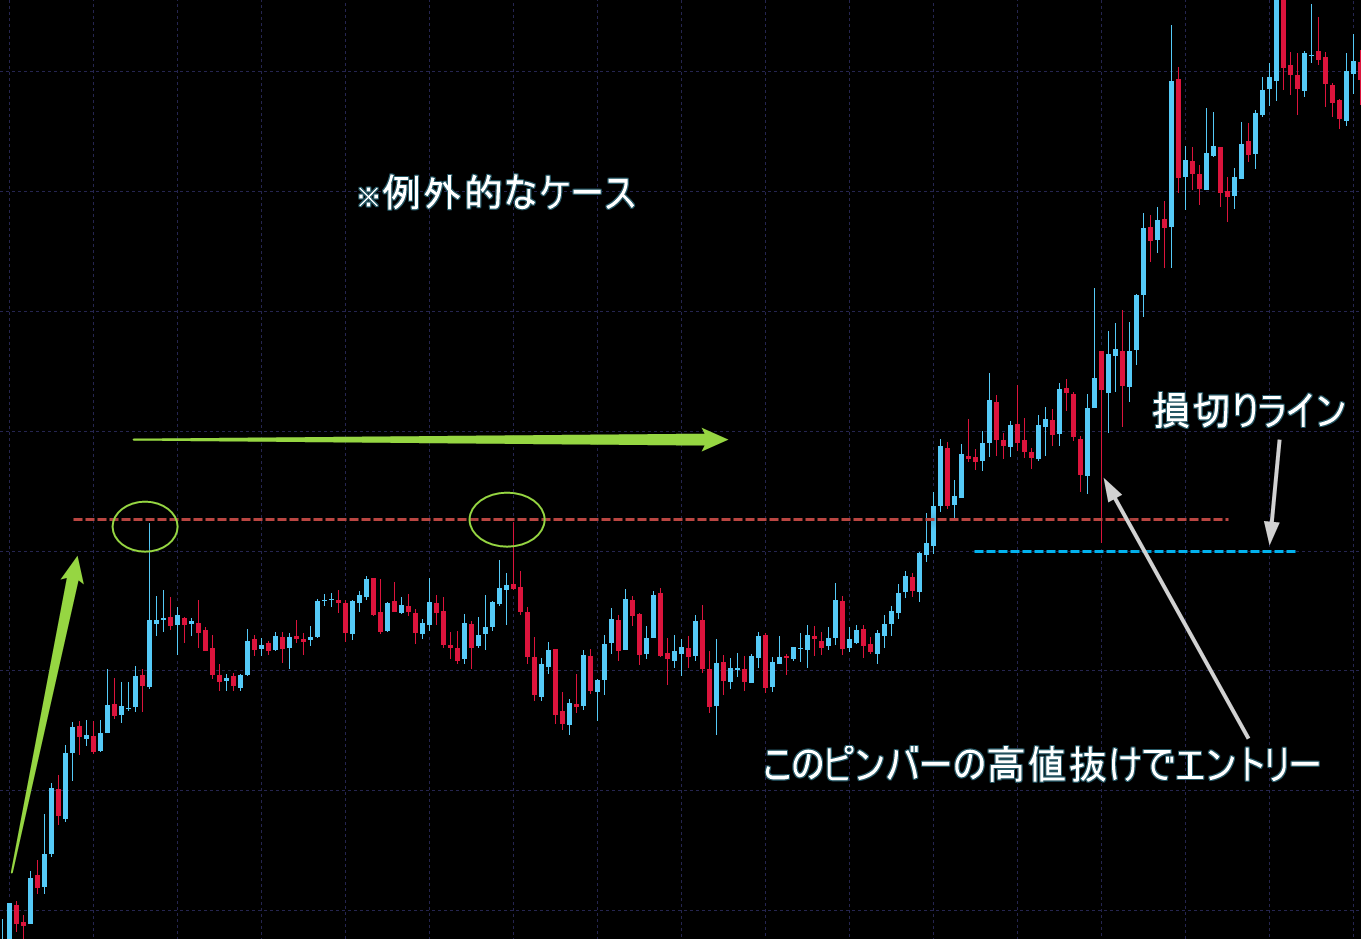
手法のルール的にはセットアップもトリガーも条件を満たしていて、優位性はしっかりと積み重なった状態になっていますので、ルール上は問題なくエントリー可能です。
しかも、ピンバーの先端がラインに少し突き刺さる格好になり、このラインがサポートとして機能する可能性が出たことから、このピンバーの安値を損切りラインとする根拠も明確になったのも好ましい点だといえます(更なる優位性の獲得)。
しかし損切りラインまでの値幅が非常に大きくなるため、リスクリワード比の検討が重要ポイントになってくるケースです。
値動きの優位性としては、下ヒゲの先には短期的に圧倒的な買い勢力の存在が示唆されているため、可能であればポジション調整をおこなってエントリーするのが妥当と考えられます。
しかしこうした点は、各トレーダーが許容できる資金リスクやメンタルリスク(この後に起こり得る乱高下の値動きに耐えられるか)に応じて、事前に検証・検討してルール化がなされていることが望まれます。
ケース4「レンジが二層に分かれているケース」
下のチャートは、セットアップの前提となるレンジが二層に分かれているケースです。
レンジの最高値(チャート左端の高値)よりも下の位置で、明確なレジスタンスラインが形成されているのが分かります。
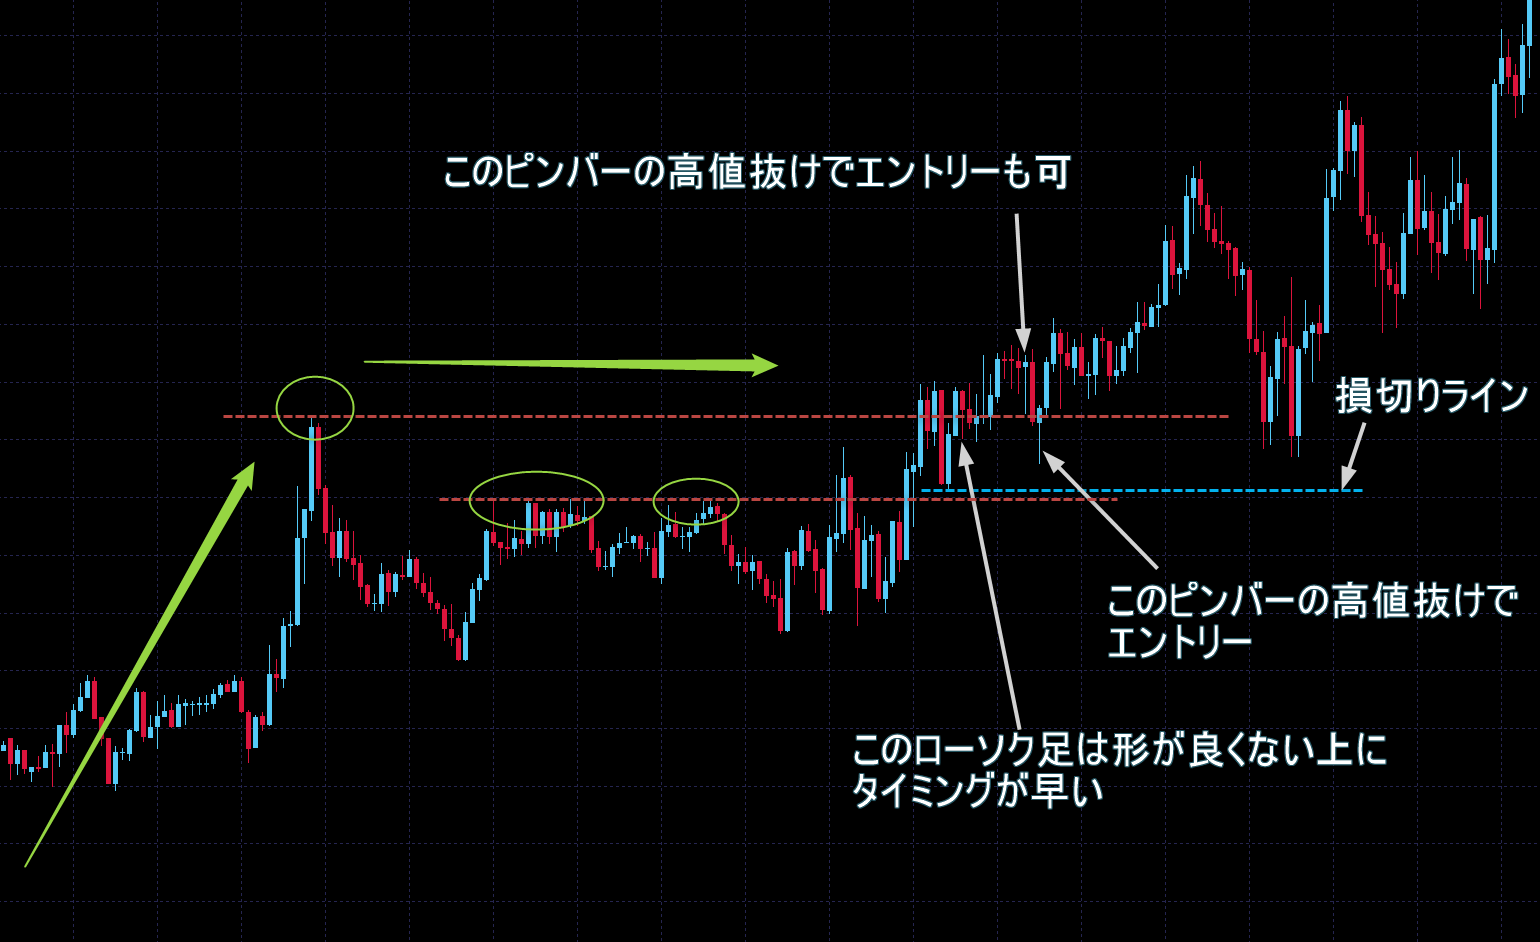
この手法のルール的には、あくまでもレンジの最高値に注目します。
もし「小さなレンジ」が最高値よりも下の位置で形成された場合、最高値を抜ける際に本格的な攻防が発生する可能性があるため、そもそもこの手法の根拠とする優位性が阻害されてしまうことになります。
ですので、レンジ最高値(最安値)のラインを抜けてロールリバーサルするか、もしくはラインに絡む(またぐ)形で「小さなレンジ」が出来るのを待つようにします。
よくあるケースとして、レンジの内側に形成されたレジスタンスラインがロールリバーサルして、そのライン上に小さなレンジが形成されることは割と高頻度で見られます。
今回のチャートでも、そのような形になっているのが分かります。
ケース5「損切りになった売りエントリー」
下のチャートでは、慎重にトリガーの優位性が生じるのを待ったものの、結果的に損切りに終わった売りエントリーの例を示しています。
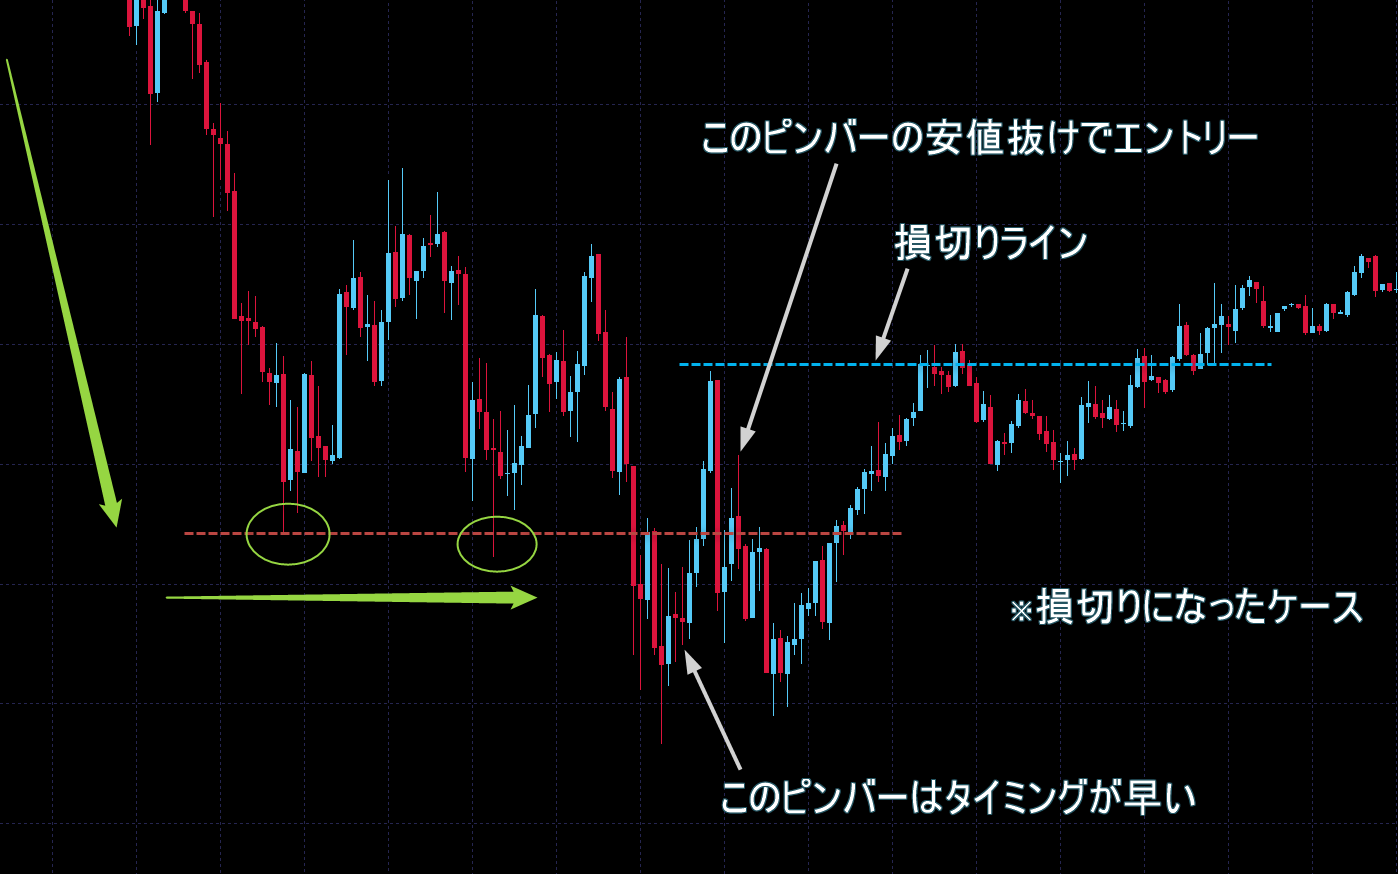
比較的広めの損切り幅だったこともあり、ポジションサイズの調整ルールの大切さが分かるチャートになっています。
どんなエントリーでも同じロットサイズ(ポジションサイズ)でトレードすることは、リスク管理面で大きな問題を抱えることになりますので、事前に十分シミュレートしてルール化しておくことをおすすめします。
ケース6「手法の根拠となる優位性を尊重する重要性が分かるケース」
下のチャートは、セットアップの「小さなレンジはレジスタンスラインをまたぐ(絡む)か、ロールリバーサルしてサポートされる状態で形成されること」という条件の大切さが分かるものになっています。
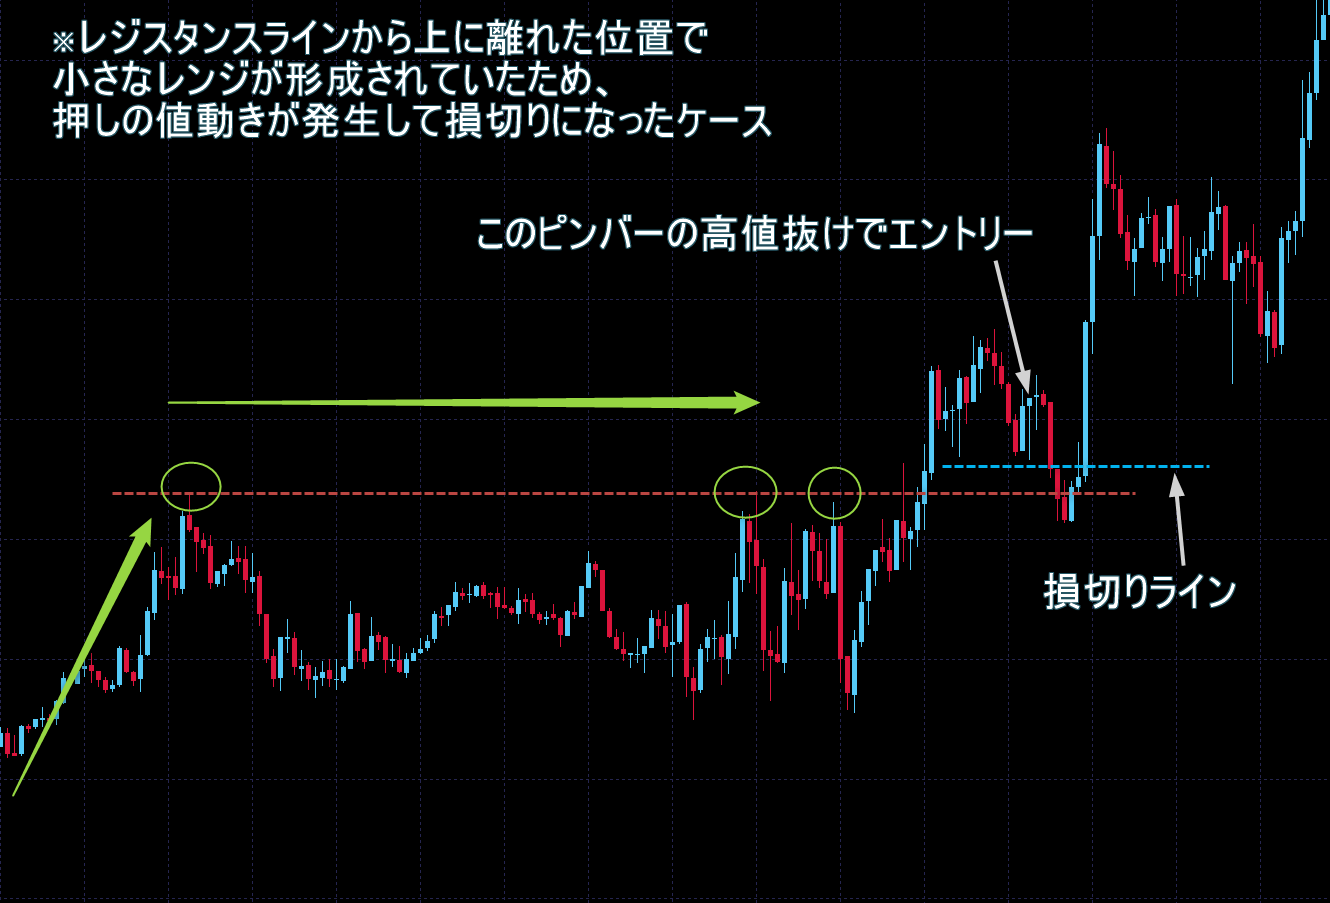
一見すると好条件に見えるのですが、「小さなレンジ」が、元のレンジ上限のラインよりも上に離れた位置で形成されています。
これは、ロールリバーサルしたラインにサポートされているとは言い難い状況であり、下落を支える根拠は「小さなレンジ」の下限ラインとピンバーの安値による優位性だけになっています。
その結果、元のレンジ上限までの押しの値動きによって「小さなレンジ」の下限を下抜けてしまい、損切り決済となりました。
この手法では「小さなレンジ」が元のレンジ上限のラインに絡む(またぐ)格好で形成されるか、もしくはラインがロールリバーサルしてサポートになっている必要があります。
その理由は、優位性を高めるために「短期的に下げ難い値動きの流れ」を背にしてポジションを持つ必要があるためです。
例えば「小さなレンジ」がレジスタンスラインに絡んでいる状態というのは、レンジを上抜けていこうとする過程である傾向があるため、短期的に見ると「上昇傾向の流れ」の中にあると考えられます。
しかしレンジ上限を一旦抜けた後は「調整(下落)の場面」になりやすい傾向があり、短期的には「反転下降の流れ」に入っている可能性があると考えられます。
そのため今回のケースのような位置で「小さなレンジ」が形成されると、一旦はレンジ上限もしくはレンジ内の何らかの安値まで押し戻されてくる可能性が出てきます。
このような値動きの反転リスクを抑えてポジションを持てるように、セットアップではラインに絡む(またぐ)かラインを背にする(ロールリバーサルしてサポートになる)かを条件として設け、優位性が阻害され難くしてあります。
ケース7「セットアップが好条件で満たされたので、トリガー条件をゆるめたケース」
最後にご覧いただくチャートは、セットアップが好条件で満たされ、優位性がしっかりと積み重なったケースです。
綺麗な三角保ち合い(下降トライアングル)のチャートパターンが形成され、下降トライアングルを構成するサポートラインの抜け方(小さなレンジの出来方)も理想的です。
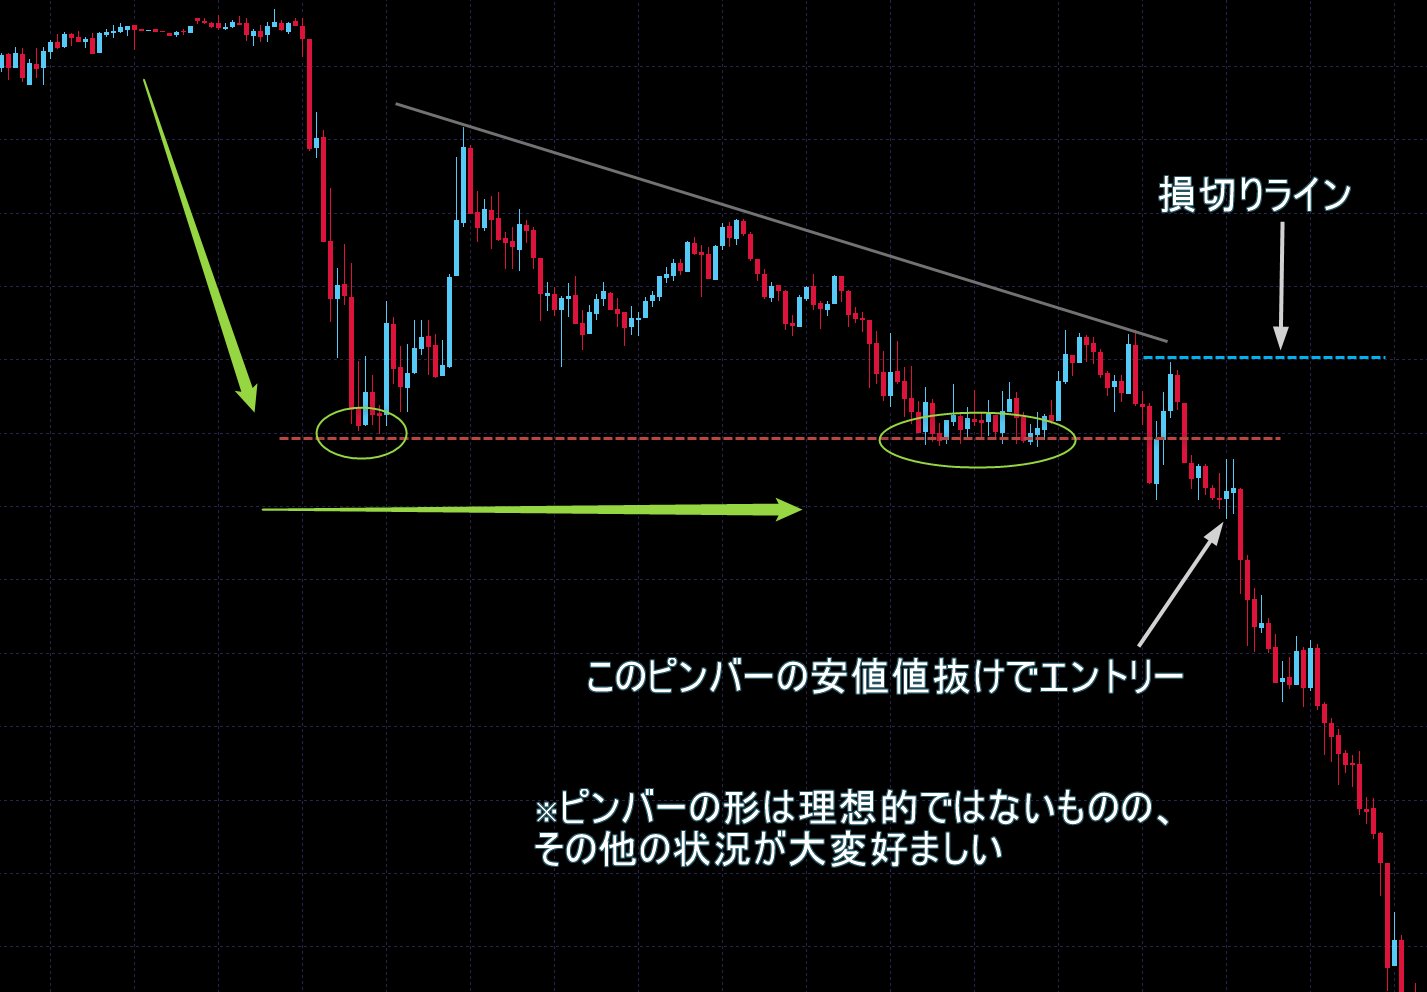
明確に意識されたサポートラインを抜けながら、ラインに絡むように「小さなレンジ」が形成されていきました。
小さなレンジの下限寄りで小さなローソク足が続き、いよいよ買い勢力がギブアップするか、という場面でピンバーを待つことになります。
しかしここで現れたのは、中途半端なヒゲを持つピンバーでした。
通常であれば、このような迷いを生じるトリガー候補のローソク足は、優位性の面からスルーしておけば問題ありません。
ですが、今回のようにセットアップが好条件で満たされているケースでは、裁量判断でリスク選好して売りエントリーをすることは妥当な判断だといえます。
いくつもの優位性を積み重ねてポジションを持つ以上、いつも満点の状態でエントリー出来るものではありません。
過去チャート検証とトレード練習を通じて、セットアップ判断の厳格さと共に、トリガー判断の柔軟性を身に着けておくことが大切になります。
「優位性を積み重ねたトレード手法」の特徴とまとめ
このトレード手法では、上位時間足のトレンドの中で起きた一時的な停滞(レンジ)と、そこから再びトレンドが継続していく値動きに乗ることを目的に、いくつもの優位性を積み重ねたものになっています。
「セットアップルール」では、トレンド回帰の流れに抵抗する勢力(上昇トレンドの場合は “売り勢力”)のパワーが弱まっていくことを値動きから確認していくという条件構成のもと、優位性を積み重ねています。
実際にエントリーするタイミングを定めた「トリガールール」では、トレンド再開の最後の局面で、反対勢力の反撃が失敗したことを示すプライスアクションを確認し、短期的な優位性の発生を得てエントリーする──というルール構成になっています。
ここまで見て頂ければお分かりの様に、誰もが知っているシンプルな優位性を積み重ねていくことで、十分に手法の骨格を形作ることが可能だということを理解してもらえたと思います。
このトレード手法をたたき台として、ここから更に実用性の高い本格的なトレード手法へと組み立てていくためには、丁寧な過去チャート検証が必要になってきます。
興味のある方はこのトレード手法を元に、過去チャート検証に取り組んでみることをおすすめします。
優位性の見つけ方とアイデア
トレード手法の基礎となる優位性は、一般的に知られているものでも問題なく活用できますが、やはりその優位性単体だけでは目立った効果は発揮され難いといえます。
そのため、多様な優位性を上手く組み合わせて積み重ねていくというアプローチが有効になってくるわけですが、この方法もFX初心者には一筋縄ではいかないものです。
そこで最初に下の記事を読んで、「過去チャートから優位性の仮説を立て、その有効性を検証する方法」について学んで下さい。
解説記事 FXの検証方法教えます。やり方が分からない人は必見「手法の作り方」
さらに続けて、「個々の優位性の具体例とそれを組み合わせる方法」について詳細に解説した、下の記事を参考にして下さい。
解説記事 『セットアップ』とは?その意味とFXトレード手法の重要部品の作り方
これらの記事を読むことで、優位性の見つけ方とその検証方法、そして具体的にトレード手法を組み立てていく方法について、理解を深めて実践していけるようになるでしょう。
複数の時間足チャートを使って優位性を活かす
ひとつの優位性でも、それを複数の時間足チャートに渡って適用することによって、優位性をより一層発揮させられる可能性があります。
「ピンバーの高安値抜け」の優位性を使用する例
例えば、プライスアクションの「ピンバーの高安値抜け」の優位性を用いる場合、トレードする時間足チャートでピンバーのトリガーが成立してエントリーした後、そのピンバーを含める形で上位の時間足でも「ピンバーの高安値抜け」が成立したら追加でポジションを持つ──というトレードアイデアがあります。
これは、より大きな時間足チャートには「より多くの相場参加者の売買の意思が反映されている」と考えられるため、より大きな時間足チャートで優位性を示すサインが現れたなら、強気でポジションを持つ妥当性があるという判断が背景にあります。
もちろんこの場合は、ポジションの増加に伴って損切りの金額が大きくなるため、ポジションサイジング(資金管理)に関するルールを明確に定めておく必要があるのは、言うまでもありません。
まとめ~不確実極まりないFX取引の世界では、優位性が頼みの綱になる
未来は誰にも分からず、FXの値動きはこの先どうなるか常に不確実です。
そんな為替相場のなかで証拠金をリスクにさらしてエントリーと決済を繰り返していくためには、確率的な傾向に従っていくことが必要になります。
そこで大切になってくるのが「優位性(エッジ)」です。
「この相場状況ではこの後、為替レートの値動きがこうなる傾向がある」という確率的な傾向──すなわち優位性(エッジ)のある相場状況を見極め、そうした優位性を積み重ねてトレードを行っていくのです。
文字通り、優位性がFXトレーダーにとって頼みの綱になりますので、あらゆる方法で優位性を捉え、優位性を活かし、優位性を磨き高めていくことが求められます。
以上、FX『優位性』とは?トレード手法の実例とその作り方を解説──についてお伝えしました。
こちらの記事もおすすめです