One of the technical analysis skills necessary for success in Forex is the ability to draw a horizontal line.
You have probably seen the terms “support and resistance lines” and “support and resistance lines” at least once.
Horizontal lines are called “support lines” or “resistance lines” depending on their role.
In this article, we will explain their respective roles, how to draw and use them, and why these lines work. Furthermore, we will explain how to create practical trade scenarios.
If you are not familiar with horizontal lines, please refer to the previous article below for a detailed explanation.
Explanation How to draw horizontal lines on a forex chart and what they mean?
- Support line (lower price support line)
- Resistance line (upper resistance line)
- Why support and resistance lines work
- Should a horizontal line be drawn on the substance of a candlestick? Should it be drawn on the whiskers?
- A change in the role of the horizon is called a “roll reversal”
- How to use support and resistance lines (lower support and upper resistance lines)
- Determine the predominant side of the selling and buying forces
- A covetous approach that follows the winning side
- It is important to consider the larger time chart situation
- Multi-Timeframe Analysis, which comprehensively analyzes multiple timeframe charts
- Points to keep in mind when entering on the basis of support and resistance lines
- How to draw support and resistance lines (support and resistance), how to use them, and why they work – Summary
- Preview of next installment
Support line (lower price support line)
A horizontal line drawn at the point where a falling rate reverses is called a “support line.
In other words, it is a horizontal line drawn at the low.
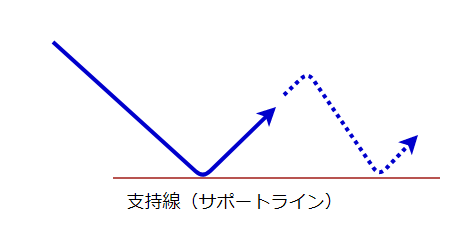
The fact that “the decline was stopped and reversed” indicates that there was a reasonably strong “power (buy orders) of buy traders” at that low.
Since they are “supporting” that rate/low, it is called a “support line” or “lower support line.
Some forex traders often draw a horizontal line “where the price has reversed at the same rate two or more times”.
If you are not familiar with this, it is easy to understand that you should confirm that the price has reversed at the same low two or more times and then draw a horizontal line connecting those two points.
In my case, I tend to be practical and draw a support line once a reversal has occurred and a low has been made.
Resistance line (upper resistance line)
A horizontal line drawn at the point where a rising rate reverses is called a “resistance line (upper resistance line).
In other words, it is a horizontal line drawn at a high price.
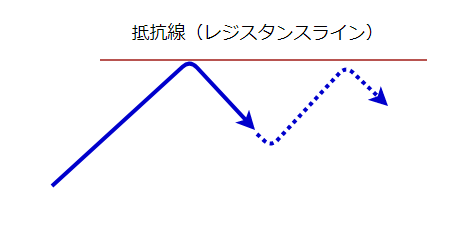
The fact that “the rise was stopped and reversed” indicates that there was a reasonably strong “power (sell orders) of sell traders” at that high.
Since they are “resisting” a break above that rate/high price, they are called “resistance lines” or “upside resistance lines.
Resistance lines, like support lines, are also often used by traders who draw a horizontal line “where the price has reversed at the same rate two or more times”.
If you are not familiar with this, it would be easier to understand if you confirm that the price has reversed at the same high price two or more times and then draw a horizontal line connecting those two points.
However, in my case, this is also practical, and I often draw a resistance line once a reversal has occurred and a high price has been made.
Why support and resistance lines work
In this section, we will explain why rates rebound or reverse at support and resistance lines (lower support and upper resistance lines).
Since the reasons for reversals at both support and resistance horizontal lines (lines) are the same, we will use support lines in this section (in the case of resistance lines, please read this section interchangeably between selling and buying).
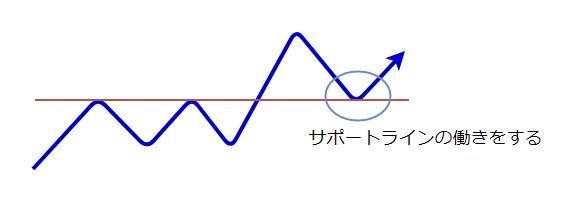
First, the exchange rate has fallen and reversed, so we have drawn a support line (lower support line) at its low.
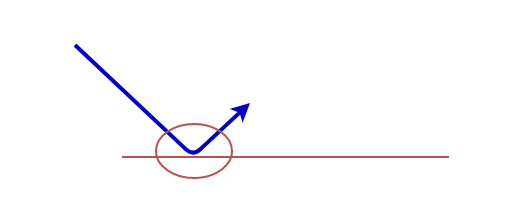
In the scene in the diagram above, there are four forex traders trading.
The first is “the trader with a sell position from the beginning of the diagram”
The second is “the trader who made a buy entry at the red circle”
The third is “the trader who made a sell entry at the red circle”
The fourth trader is the “wait-and-see trader”.
Then, when the rate reaches the support line (lower support line) again in the blue circle, what will the four traders do?
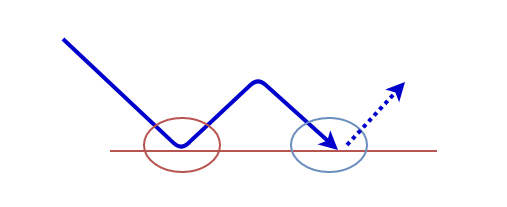
The first “trader who has a sell position from the beginning” has unrealized profit. However, since he saw the price rebound once at the red circle, he thinks, “Let’s secure as much profit as possible,” and makes a “buy,” which is a profit taking settlement, at the blue circle.
The second “trader who made a buy entry at the red circle” sees the rate go up and thinks, “I should have bought more,” and therefore makes a “buy” at the blue circle.
The third “trader who made a sell entry at the red circle” sees the rate go up and has an unrealized loss, so he/she makes an exit/settlement “buy” in order to escape when the rate returns to the open price at the blue circle.
The fourth “trader who was watching the market” regretted that he “should have bought” once he saw the rate go up, so he gladly “bought” in the blue circle.
– What a surprise, everyone “bought” in the blue circle.
Although real forex trading is not this simple, the sentiment of many market participants at the support line (lower support line) tends to remain like this.
Therefore, rates have a tendency to rebound or reverse again at support lines (lower support lines).
This is the reason why support and resistance lines (lower support and upper resistance lines) work and why trading strategies that take advantage of rebound and breakouts at these lines have an advantage.
As you become more familiar with the use of support and resistance lines, you will be able to identify the point where you can tell whether the price will reverse there or break out.
This means that you will be able to judge the trend of price movements from there through the chart patterns that appear on the lines.
Specific examples of support lines (lower price support lines) functioning
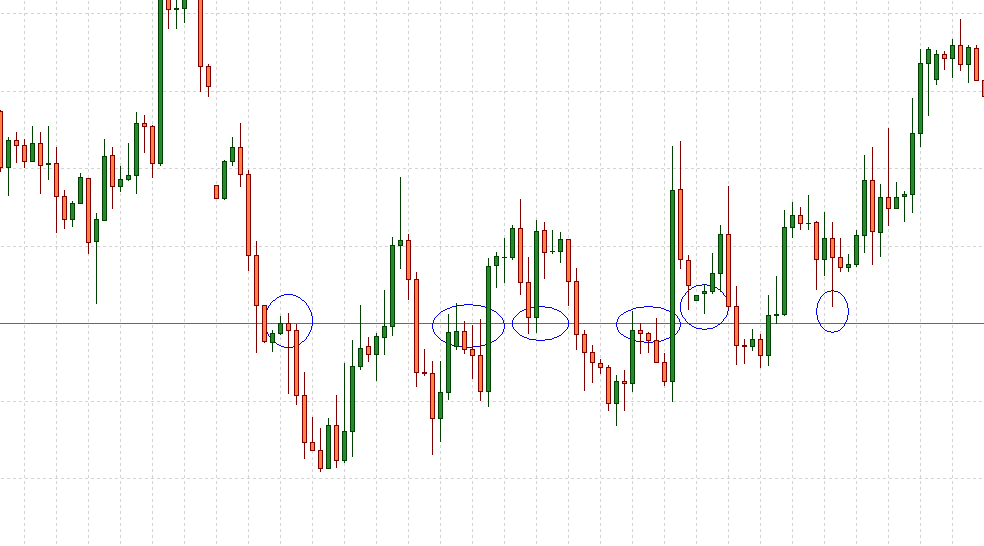
The hourly Eurodollar currency chart below shows a support line (lower support line) forming and rebounding with multiple buy orders near the low of the support line.
*Click on the chart to enlarge.
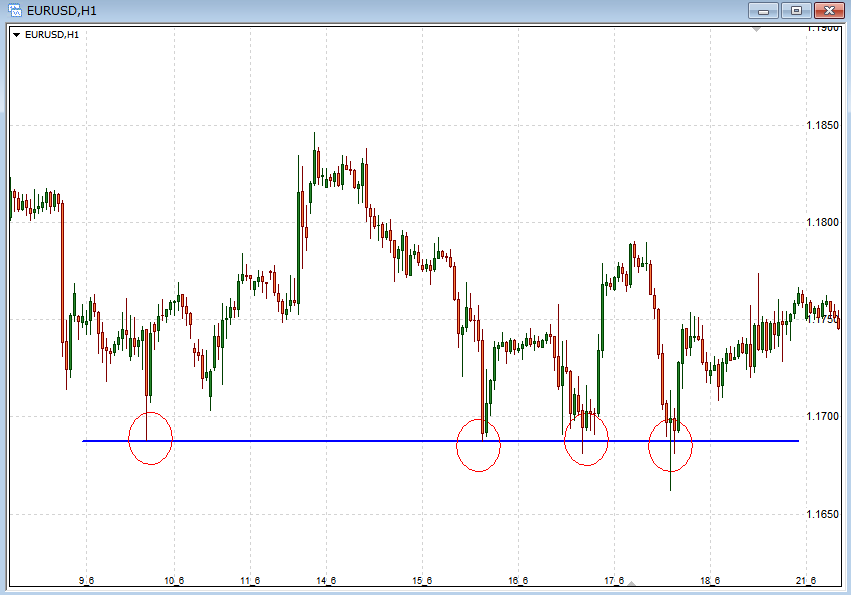
The blue horizontal line is the lower support line.
When the exchange rate falls to the level of the support line (lower support line), resistance to selling forces begins to appear, and we can observe a temporary rise in the rate due to an increase in buying orders.
What is interesting about this Eurodollar chart is the price action of the first and second rebound from the right.
If you look closely, you can see that both of them are at the lower whiskers of the candlestick, once below the support line.
If you had been watching this chart in real time, you would have seen a long bearish candlestick gouging through the support line.
However, the result was strong buying, which pushed the price higher, and the candlestick was confirmed in the form of a long mustache.
The rebound on the far right has a very long lower whisker.
How disappointed the selling forces must have been at this time when they saw how the rate was pushed down strongly to the rate at the tip of the lower whiskers, but eventually pushed back up to above the support line.
Specific examples of resistance lines (upper resistance lines) working and then breaking out
The hourly Eurodollar chart below shows the formation of a resistance line (upper resistance line), followed by an attack against the line, then a breakout and a renewed rise in the exchange rate.
*Click on the chart to enlarge.
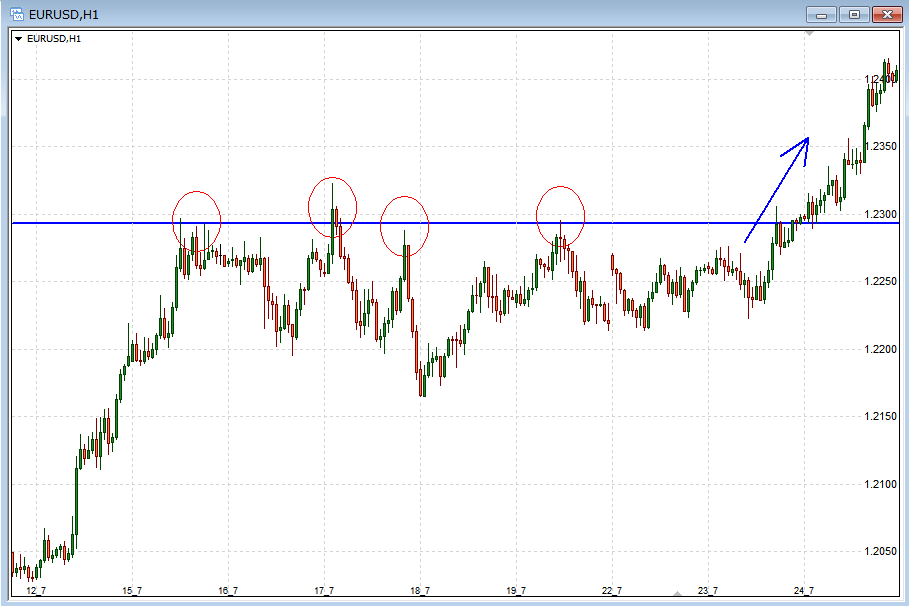
The blue horizontal line is the upper resistance line.
When the exchange rate rises to the level of the resistance line (upper resistance line), we can observe that the opposite force, selling resistance, begins to appear and the rate tends to fall.
In the second red circle from the left, the price broke through the resistance line at the close, but immediately afterward it turned back and was pushed down.
At the third red circle, the price again approached the resistance line, but this time it did not break above the line and was pushed down more strongly than before (a series of longer bearish candlesticks).
Moreover, this time the drop was the lowest since the attack on the resistance line began.
This was the point at which the buying forces could have given up on the upside if the rate had continued to not rise for some time.
The result, however, was another push up to the resistance line, forming a narrow range around the line and then breaking the line.
When the price rises above the resistance line (upper resistance line), as shown in this example of the 1-hour Eurodollar chart, it means that the buying power is that strong, and there is a possibility that the price will move toward higher rates.
Should a horizontal line be drawn on the substance of a candlestick? Should it be drawn on the whiskers?
If you are an experienced forex trader, you may have wondered whether to draw horizontal lines at the tip of a candle’s whiskers or at the edge of its substance (opening or closing price).
The purpose of drawing support and resistance lines (lower support and upper resistance lines) is to identify and clarify the rates that participants in the foreign exchange market are likely to be paying attention to.
At the exchange rate that is the focus of attention, there is a possibility that something (a violent buying or selling offensive) may occur in the future. The line is drawn in order to grasp this in advance.
Therefore, one should not try to pinpoint the right line by looking for the right answer to “where to draw the horizontal line on the candlestick. It is important to think in terms of, “Which rate are most market participants paying attention to? It is important to think from the perspective of “Which rate are most market participants paying attention to?
Let’s look specifically at the exchange rate chart.
*Click to enlarge.
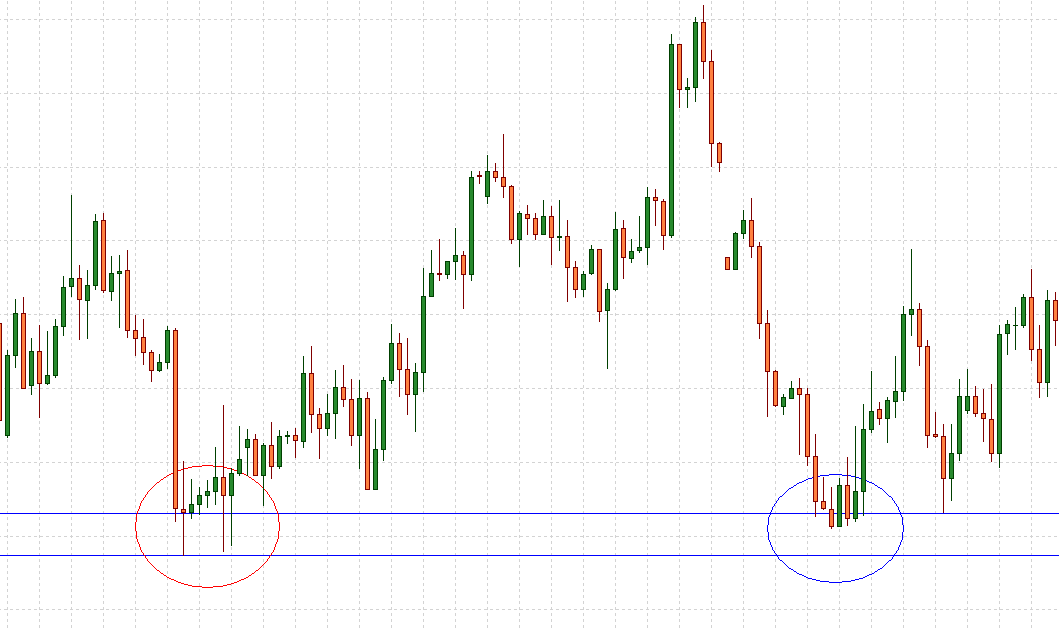
Since the rate has reversed at the red circle on the left, a support line (lower support line) is to be drawn, and there are two options.
We can either draw a support line at the tip of the candle’s whiskers or at the edge of the candle’s substance (opening price or closing price).
The candlestick at the reversal point in this chart has long whiskers, so it is difficult to decide which to choose.
In such a case, we recommend to draw horizontal lines on both sides and treat them as “support zones”.
In other words, if the price falls into this zone again, then there is a possibility that a buy/sell battle will occur within this zone.
In fact, as you can see in the blue circle on the right, the rate reversed and rose within the zone.
The above example was for a support line, but the same can be applied to a resistance line.
The fact that you are lost also indicates the hesitation of other market participants
Which horizontal line, the candlestick’s whiskers or its substance, will cause a reversal?” If you try to narrow it down to a single answer, you will quickly become confused.
If you are confused, there is a possibility that other forex traders are also confused.
They may be wondering, “Which horizontal line is more important, the whiskers or the substance? You can imagine that other forex traders are also skeptical about the horizon line.
Then we should not be in a hurry here. We should draw horizontal lines on both sides and watch carefully to see where in that price zone the buying and selling will occur.
When participants in the currency market are divided in their opinions, it is difficult for rates to move in a straightforward manner.
The price tends to move in a way that frustrates you: one minute it pulls out, the next it pulls back in, and the next it pulls out again.
And if you are frustrated, many other forex traders are also frustrated and unable to discern such price movements, making it difficult to reach a clear consensus on whether to go up or down.
Rather than focusing only on “whether it is the whiskers or the substance,” it is important to look at it comprehensively from an overall perspective, imagining the feelings of other FX traders, along with the direction and flow of the major trend.
Furthermore, while it is important to use support and resistance lines (lower support and upper resistance), they are only one part of the analysis in a trading strategy and should not be obsessed and trapped by them alone.
– Up to this point, we have looked at “rate reversal situations” at support and resistance lines (lower support and upper resistance lines).
Next, we will explain what happens to the broken horizontal line after the exchange rate breaks out of the horizontal line and how to use the horizontal line after the breakout.
A change in the role of the horizon is called a “roll reversal”
Roll reversal is the interchange of the roles of support and resistance lines depending on the position of the exchange rate and the horizontal line.
It is also known as “support-regi reversal (resi-support reversal)” and is considered an important element of technical analysis.
Let’s take a closer look at this roll reversal below.

The figure above shows how the exchange rate broke the resistance line (upper resistance line).
Traders who had a sell position at the exchange rate below this resistance line (upper resistance line) have incurred unrealized losses.
Also, traders who had been waiting to see what would happen are now saying, “It’s broken! I want to buy!” and will regret it.
Then, what will happen if the rate falls after this?
Around the broken resistance line (upper resistance line), “buy orders to settle” by sell traders who want to escape at the open price and “new buy orders” by wait-and-see traders who failed to buy are waiting for each other.
This means that “buying power is strong near the horizontal line in this market condition, and the rate is likely to reverse upward.
In other words, “the same situation as the support line (lower price support line)” appears here.
To summarize, a resistance line (upper resistance line) that breaks out (breaks through) may then play the role of a support line (lower support line).
Similarly, a support line (lower support line) may also play the role of a resistance line (upper resistance line) after a breakout.
This switching of roles of horizontal lines is called “roll reversal”.
Utilizing this roll reversal is also an important element in creating a trading strategy.
Roll reversal is not always a one-time event
After a breakout of a support or resistance line (lower support or upper resistance line), the roles are then switched (converted), which is called a “roll reversal,” and roll reversals can occur many times on the same horizontal line.
Since it is quicker to look at an actual example, please see the chart below.
*Click to enlarge.
The price has repeatedly broken out of a single horizontal line, and you can see that the blue circle acts as support (lower support line) or resistance (higher resistance line).
The horizontal line that should have broken out at one point breaks out again in the opposite direction, then rolls back and reverses – such price movements are repeated.
This example was an extreme case because of the range market, but in this way, when support and resistance lines break out, roll reversals can occur and their roles can be switched.
Therefore, you should not immediately erase a horizontal line you have drawn just because it has been broken out once, saying that it is no longer of interest.
Remember that a roll reversal could then occur and switch roles and function.
How to use support and resistance lines (lower support and upper resistance lines)
We have told you why horizontal lines (lines) work, how to draw them and what role they play.
From here, we will explain the practical use of support and resistance lines in Forex.
Determine the predominant side of the selling and buying forces
Lines drawn at highs and lows of interest – in other words, support and resistance lines – can become battlegrounds where forces that want the price to go no further collide with those that want to break out at all costs. I am sure you are well aware of this fact.
In other words, this is the stage of a fierce battle where forces to sell and forces to buy collide.
For example, a break above a resistance line (an upper resistance line) may cause the buying forces to gain momentum and the exchange rate to rise.
If the resistance line reverses the exchange rate downward, the selling forces will gain confidence and the exchange rate may fall.
A covetous approach that follows the winning side
If this is the case, then the approach of observing “how the battle on the horizontal line will be settled” and entering the market according to the side that is considered to be winning is considered to be the superior approach in FX trading.
After observing the outcome of the game at the support and resistance lines, you can decide whether to take a position on the “selling” or “buying” side of the line.
For example, suppose the exchange rate reaches a support line (lower support line) drawn on the hourly chart (see figure below).
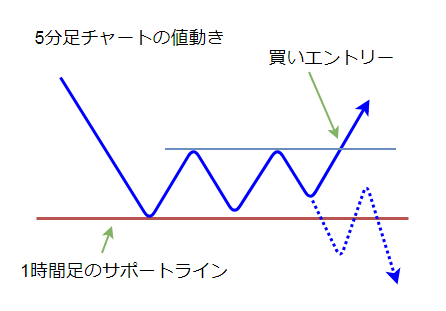
So, switch to the 5-minute chart and observe how the price fights near the support line.
If a range is formed on the 5-minute chart and then breaks out further up through the upper edge of the range, we can judge the price movement as an indication that the 1-hour support line (lower support line) may be functioning, and a buy entry scenario is possible.
Of course, there could also be a scenario where the price breaks out of the lower end of the 5-minute range and breaks below the hourly support line (lower support line).
In this case, a low-risk scenario would be to enter the market after confirming that the price has clearly broken below the hourly support line in the price movement shown by the dotted arrow in the figure.
This kind of “trade following the winner’s side” is effective around support and resistance lines, but the important thing here is to clearly establish a scenario (trade plan) in advance, saying, “If this happens, I will do this.
It is important to consider the larger time chart situation
One thing to remember here is that the larger the time horizon, the more attention it receives from market participants.
In a market situation where the price is about to break below the hourly support line (lower support line), you should not make a technical analysis only by looking at the hourly chart, but you need to make a comprehensive judgment in conjunction with the positional relationship with the 4-hourly and daily horizontal lines.
For example, suppose the daily chart is in an uptrend.
Let us consider a situation where the hourly support line is about to break out below near the support line (lower support line) drawn at the low of that daily chart.
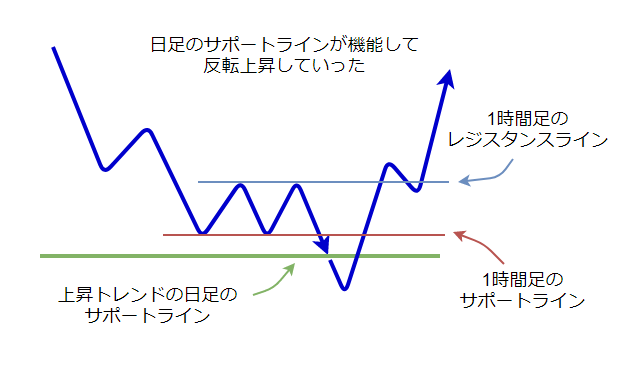
Looking only at the 1-hour chart, the situation seems to indicate that the support line (lower support line) will finally break out to the downside and the price is likely to fall sharply.
Moreover, since the 1-hour chart had been in a downtrend until then, it is also a situation where “breakout to the downside,” the direction in which the trend will continue, has an advantage even once the market is in a range, as it is now (trends tend to continue until a clear sign appears).
However, there is a daily support line in an uptrend in front of it.
So here, the attention of many currency market participants is focused on the following points
- Will the daily support line work and the exchange rate rebound?
- Will the hourly downtrend continue?
As for what happened this time, the price once broke below the hourly support line (lower support line), but buying forces soon pushed the price up at the daily support line.
The buying momentum was so strong that the exchange rate rose quickly and vigorously in a short period of time, breaking out of the hourly resistance line as well (the hourly trend turned to an uptrend at once).
Therefore, in this case, it would have been appropriate to continue watching the market closely, judging that a sell entry from below the hourly support line would be at high risk of a counterattack by the buying forces from the daily support line.
In addition, a “buy” entry scenario at the breakout above the 1-hour resistance line (upper resistance line) should also have been carefully considered beforehand.
Multi-Timeframe Analysis, which comprehensively analyzes multiple timeframe charts
Thus, when using support and resistance lines, it is important to carefully look at the relationship with the chart situation of the upper time leg (the time axis larger than the current one) to identify a market situation that is advantageous (creating a bias of trading forces).
More to the point, one of the recommended trading strategies in Forex is to aim for a situation where the direction of the trend on the large hourly chart and the direction of price movement on the shorter time axis begin to align.
In this case, this means that a scenario that targets a situation where the upper resistance line of the hourly range has been exceeded and the conditions for an uptrend are in place would be an advantageous trade.
And this trade scenario will be the practice of “push-buy” on the daily chart.
In this case, we analyzed the attack and defense at the horizontal line by focusing on the relationship between the daily and hourly time frames.
Multi-time frame analysis is an essential skill in Forex trading, and it is an analysis technique that you will eventually need to master.
The details of multi-time frame analysis are explained in the article below.
Explanation What is Multi Timeframe Analysis? Methods and Tips, Forex Methodology
Points to keep in mind when entering on the basis of support and resistance lines
As we have explained, in the vicinity of support and resistance lines, exchange rates generally tend to push back and reverse at least once.
However, this does not necessarily mean that the price will always reverse. It is often the case that the price will break out all at once, as if to say, “I didn’t know there was such a thing as a horizontal line.
Therefore, it is necessary to understand that entering a market based on arbitrary assumptions is a reckless trade that disregards risk.
First of all, we will check chart patterns and individual price actions to confirm the fact that the exchange rate has become difficult to fall near the support line or has begun to react at the resistance line.
With the evidence of such price movements as a backdrop, we recommend that you carefully hold a position, setting your stop-loss line at the chart point where either the buying or selling forces have no choice but to give up the position.
How to draw support and resistance lines (support and resistance), how to use them, and why they work – Summary
So, I have explained about support and resistance lines.
Although some of them may have been difficult, I hope that many of them made you think “I see” what I mean.
What is important to get results in FX trading is to actually draw support and resistance lines by yourself.
Various market conditions and phases appear on FX charts. It is necessary to judge the strength and weakness of the horizontal lines according to the situation and consider them comprehensively.
When I was a beginner, I also had a tendency to underestimate the importance of drawing horizontal lines.
What is the point of such a horizontal line? I was thinking, “What is the point of such a horizontal line? Looking back on it now, I feel ashamed of myself! I am ashamed to think about it now, and I feel like giving a blackmail to myself at that time.
So, I would like you to master chart analysis using lines.
This is my explanation of what “support and resistance lines” are, how to draw them, how to use them, and why they work.
Preview of next installment
In the following article, we will cover double tops and double bottoms.
We will explain in detail the meaning of the pattern and how to trade it, following the collective psychology of the market participants.
Please click on the link below.

We also recommend this article