
あなたは、ダブルトップやダブルボトムのチャートパターンで、思ったようにトレードできていますか?
教科書的に「ネックラインを抜けたらエントリー」とやっていても、それだけでは安定的に勝ち続けることは難しいと言わざるを得ません。
この記事では、相場の集団心理を詳細に見ていきながら、テクニカル分析の基本パターンのひとつであるダブルトップ・ダブルボトムについて、このパターンでのトレード方法を中心に詳しく解説していきます。
今回の内容は、前回の「サポートライン・レジスタンスライン」の記事を読んでいることを前提に、説明を進めていきます。もしまだ読んでない場合は、以下のリンクから読んでおいて下さい。
ダブルトップ・ダブルボトムとは?
ダブルトップとは、特徴的な「高値」が二つ連なって出来たチャートパターンです。
ダブルボトムとは、同じく特徴的な「安値」が二つ連なって出来たチャートパターンのことです。
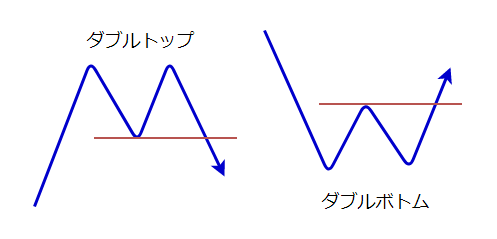
どちらのチャートパターンも、それまでの値動きとは逆方向へ反転していく可能性を示唆する「反転パターン」として知られています。
ダブルトップは、為替レートがそれ以上は上昇できずにいる相場状況をあらわしていて、ダブルトップが形成されるとその後に反転して下落する可能性があるチャートパターンだとされています。
ダブルボトムは、その反対の意味を持つチャートパターンで、特徴的な「安値」が二つ連なって出来たチャートパターンです。
ダブルボトムも同じく、レートがそれ以上は下げられず、そこから反転上昇する可能性を示すパターンです。
ダブルトップとダブルボトムは、為替取引(FX)や株取引のテクニカル分析でとてもよく用いられる、相場参加者からの注目度が高い特徴的なチャートパターンのひとつです。
ダブルトップ・ダブルボトムで上手くトレードするには?
ここまで、いくつものテクニカル分析記事を通して、トレンドとレンジのことやダウ理論、そしてサポートライン・レジスタンスラインのことを詳しく解説してきました。
そのなかでも触れてきたように、トレード戦略を立てる上で重要なのは、相場の流れ(トレンドの有無とその方向)であり、そこにあらわれる集団心理です。
相場の流れと集団心理を無視して、ただチャートパターンを機械的に判断してトレードしていても、まったく上手くいかないでしょう。
それが、ダブルトップ・ダブルボトムでの「ネックラインを抜けたらエントリー」という教科書的なトレードが上手くいかない理由です。
チャートパターンを使って上手くトレードするためには、「そのパターンがあらわれた状況」を理解し、さらに「集団心理がどう働くか」を考えていく必要があるのです。
そこはチャートの転換点となり得るポイントか?
ダブルトップ・ダブルボトムのチャートパターンは「反転パターン」と呼ばれるものです。
文字通りそれまでのトレンドが方向感を失い、反転していくパターンです。
先ほど、有利なトレード戦略を立てるためには、集団心理について考えることが重要だといいました。
では、ダブルトップ・ダブルボトムのパターンが成立して、相場参加者たちが「これは反転するかもしれないぞ!」と思うような状況とは、どういうものなのでしょうか?
ここまで「高値・安値」や「サポートライン・レジスタンスライン」のことをしっかり理解してきたあなたなら、ある程度想像がついているかもしれませんね。
「これは反転するかも?」とみんなが思うような状況──それは、多くのトレーダーたちから注目されるレートの付近でパターンが形成されていく状況です。
1分足や5分足といったチャート上で反転パターンが形成されていっても、それに注目しているトレーダーの人数は限られています。そもそも、こうした小さな時間足のチャートを見ていないトレーダーも多いのです。
しかし1時間足や日足、週足などの大きな時間足チャートは、様々なトレーダーたちが日々分析と監視を続けているので、注目しているトレーダーの人数は桁違いに増えてきます。
つまり上位時間軸(大きな時間足チャート)のライン付近でパターンが形成されていく状況だと、多くのトレーダーたちが「反転しそうだ!」と思い始めるのです。
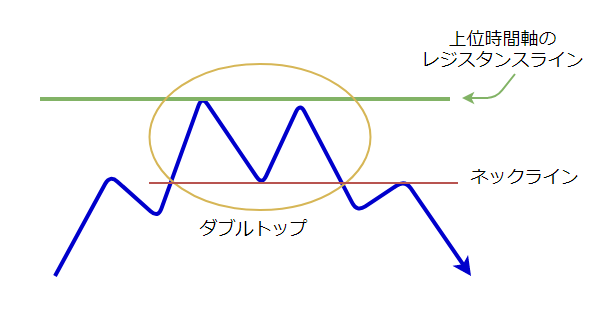
こうした、多くのトレーダーたちが「ここで反転してもおかしくないよね」と思うようなポイントで、反転パターンのダブルトップ・ダブルボトムがあらわれ始めると、集団心理的に反転の可能性が高まっていくわけです。
このポイントを押さえておくだけでもムダな負けトレードが減らせるくらい、これは大切なポイントです。
それは、チャートが教えてくれるサイン
別のいい方をすると、上位時間軸のサポート・レジスタンスラインの付近や、そこに絡むような形でダブルトップ・ボトムのパターンがあらわれたなら、それは「今から反転する可能性があります」という、チャートからのサインなのです。
このサインは、相場参加者たちの感情──集団心理によって作り出されたものです。
それを読み解くことができれば、あなたはそのパターンのなかで有利にトレードすることが可能になります。
ダブルトップでの集団心理を解剖する
では、その集団心理を追いながら、反転パターンが出来上がっていく様子を詳しく見ていきましょう。あなたにもパターンが発する「サイン」の意味とその「使い方」が、徐々に分かってくるはずです。
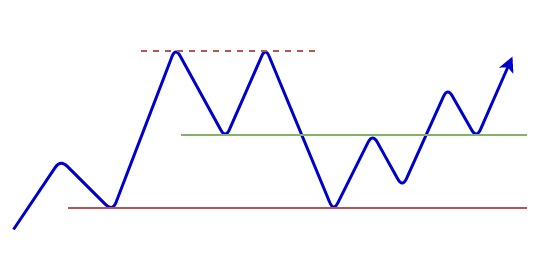
まずは下の図を見てください。
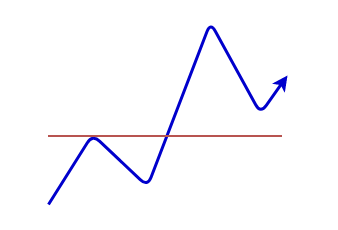
高値に引いた、赤いレジスタンスラインをブレイクアウトしています。その後、最高値をつけたあと反転してきて、今度は安値をつけました。
ここまでは、トレンド状態が続いていることが分かります。
相場参加者の集団心理としては、「トレンド状態だから、次も高値を更新していくかも?」というムードになっていると思われる状況です。
トレンド状態への不信感が芽生える
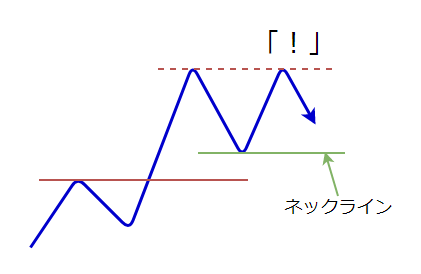
ところがレートは高値を更新できず、反転して下落してきました。
このあたりで集団心理は「あれ?思ったよりトレンドが弱いのか?」と、トレンド状態に対して「不信感」が出始めます。
そして、この「高値を更新できずに反転してきた」タイミングで、ひとつ前の安値にサポートラインを引いておきます。
これが、「ネックライン」です。
ネックラインを抜けて、さらに不信感が強まる
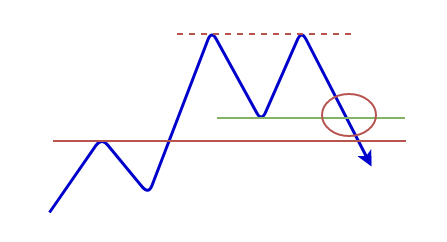
その後、レートはネックラインを下抜けてしまいました(赤丸)。
(※さらに、以前引いた赤いラインは、ロールリバーサルになることなく、これも抜かれてしまいました)
こうなると相場参加者の集団心理は、トレンドへの不信感をとても強めます。ましてや、買いポジションをもっているトレーダーたちは、心配でたまらないでしょう。
集団心理が「反転」へと傾きはじめる
気の早いトレーダーたちは、この「ネックライン抜け」のタイミングで売りエントリーを仕掛けてきます。彼らはこの時点で「もう、反転するに違いない!」と判断しているわけです。
確かにネックラインを抜けた段階で、トレンドに乗ってポジションを持っていたトレーダーたちが利食いを始めますので(=決済の売りを行う)、レートが一時的に大きく下がる可能性は十分あります。
ですから「ネックライン抜け」のタイミングでエントリーすることを、リスクが高いからといって否定することは出来ません。
しかし、ダウ理論でみてみると、まだ上目線
でもここで、「トレンドの定義」と「目線の定め方」のことを思い出してください。
※もし、あなたが「トレンドの定義、目線の定め方ってなんだ?」となっている場合は、以下の記事をよく読んで理解してください。
集団心理としては、「押し安値」を下抜けるまでは、トレンドの方向感がなくなったわけではないと考えられます。
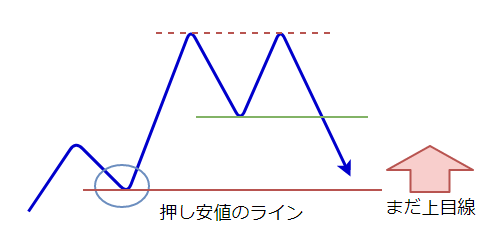
トレンドの定義に当てはめてみると、まだ上昇トレンドが終わったわけではないですし、目線も上目線が継続中なので、何らかのタイミングで、買いの勢力が息を吹き返す可能性がある状況です。
つまり「ネックライン抜けで売り」は、集団心理的にはまだまだ「上!」な状況の中でのトレードなのです。
これが、ネックライン抜けのタイミングでのトレードを「早い」と判断する理由です。そして、チャートパターンだけに従ってトレードしても上手くいかない理由でもあるのです。
大切なのは、大きな時間足の視点から見た全体の状況です。
押し安値で反発するものの、反転ムードは強まる
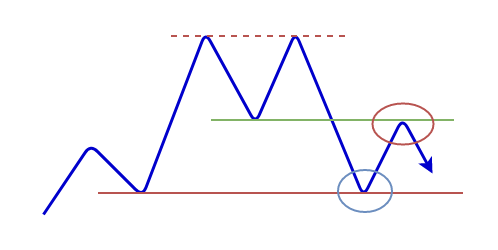
その後、やはり「押し安値」のサポートラインで支持されました(青丸)。
「押し安値」は、大きな目線で「上昇トレンドは継続中だ」と判断していたトレーダーたちが、安く買えると考えて買いエントリーを仕掛けてくる場所です。
しかしその後は、赤丸でネックラインがレジスタンスラインとなって(ロールリバーサルが起こって)レートが反転下落してきました。
集団心理としては「これはもう、上昇することはないかも……」と、かなり弱気になっていることが想像できます。
パッと見た印象で、このチャートがこれから上昇していくイメージを、どれほど持てるでしょうか?
買いポジションをもっていたトレーダーの多くは、我先に逃げ始めて、決済の売り注文を出す可能性があります。
チャンスをうかがっていた売り勢力が本格的に参入
こうなってくると、反転での売りトレードのチャンスをうかがっていたトレーダーたちが、本格的に参戦して売りポジションをもち始めます。
その理由はなぜでしょう?
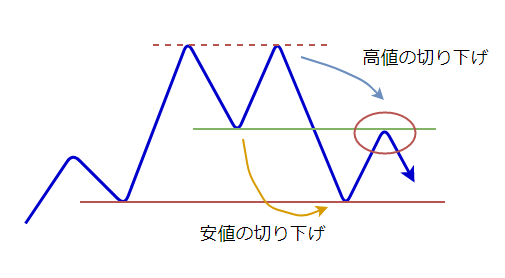
それは、ネックラインの下にできた、赤丸の「高値」ができた時点で、「高値と安値の切り下げ」が起きる可能性があらわれたからです。
ここで「トレンドの定義」を思い出してください。それは「高音と安値の切り上げ(切り下げ)があること」でした。
現時点ではネックライン付近で反落の値動きが見られ、「高値が切り下がった」と判断し始めた相場参加者たちがいると思われる状況です。
もしこのまま下落を続けて、切り下げた安値を下回って安値を更新して「高値の切り下げ」が明確になったならば、下降トレンドの定義が満たされることになります。
つまり、図の位置では「下降トレンドの条件が満たされる可能性が生じた」と考えることが出来るわけで、トレンドの初動に乗れる可能性があるといえます。
ですので、このタイミングがダブルトップでの効果的なエントリータイミングのひとつだと見ることが可能です。
しかし、ここでもよく考えてみましょう。
相場では、どんなことも起こり得る
「なるほど、こうやって判断して、そこでエントリーすればいいのか!」
あなたは、そう思っているかもしれませんが、相場ではどんなことも起こり得るのです。
トレンドの定義と目線の定め方のことを、もう一度よく思い出してください。
このチャートでは、依然として「上昇トレンドが継続中」であり「上目線」──つまり集団心理としては「まだ上昇する可能性は残っている」と思われている状況なのです。
ダウ理論では「トレンドは明確なシグナルが発生するまでは継続する」というものがあり、現時点では押し安値を下抜けていない以上、いくら下降トレンドの可能性がある状況が生じたとしても、まだ上昇トレンドが継続中なのだと判断できます。
この状況を言い換えると「買いと売りの勢力がぶつかり合っている場面」といえます。
今回のチャートでは、シンプルに考えるために、このチャートよりも大きな時間軸のことは割愛していますが、もし、大きな時間軸が強い上昇トレンドだったとしたら、どうでしょう?
その場合、上のチャートのような展開になっていくことも、十分に考えられるわけです。
このように、もし大きな時間軸が上昇トレンドだったなら、今回の「押し目での反転」は絶好の買いエントリーのタイミングになってきます。
いくらチャートパターンとしては「反転~下降しそうな形」になっていたとしても、集団心理として「上昇する可能性がある」といえる状況ならば、安易に反転方向へトレードすべきではないと言えます。
ここで補足を
補足として、こうした場面で「大きな時間軸に逆らった方向だ」と理解した上で、ひとつの積極策として「高値の切り下げを早期に判断して売りエントリー」をすること自体を、私は否定しません。
むしろ状況を把握した上で、利食いターゲットを定めて、小さな損切りをつかってトレードするシナリオは妥当なものだと思います。
こうしたことを理解せずに、安易に「利益を出せるはず!」と思ってトレードするのがダメなのです。
いよいよ集団心理は「反転一色」へ
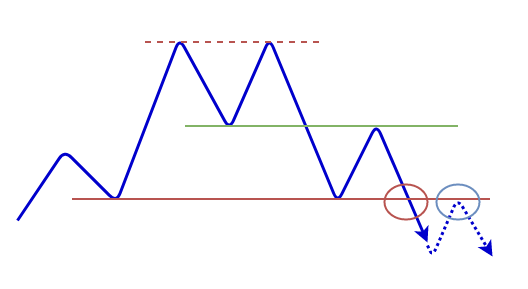
さあ、ついに赤丸で押し安値を下抜けてきました。
押し安値を下抜けて、目線が上ではなくなり上昇トレンドが否定された時点で、ここまで買いポジションをもっていたトレーダーたちの多くが「もうダメだ……」という心理に陥ります。
いよいよ集団心理的に「これは反転するよね」ムードになり、レートは下落していく可能性が高まっていくのです。
実際のトレードの場合、損切りの幅が許容できれば、この赤丸のタイミングで積極的に売りエントリーしてもいいと考えられます。
安全策としては、そこからさらにレートが戻ってきて、押し安値のラインあたりで反発したのを確認してからエントリーするのがおすすめです。
ダブルトップ・ダブルボトムの意味とトレード方法~まとめ
ここまで、ダブルトップでの集団心理について見ていきながら、パターンが形成されていく様子を解説してきました。
お分かりのように、「ネックラインを抜けたのでエントリー」というだけでは、ダブルトップ・ダブルボトムで安定的に勝っていくことは難しいです。
確かに、ネックラインに絡むポイントでは明らかに集団心理が傾き始めますから、戦い方によっては利益を得ることも可能でしょう。
しかしそこでは、注意すべきポイントがあるのです。
それは、押し安値・戻り高値の存在です。
大きな目線で集団心理の変化を追っていく
多くのトレーダーが注目している押し安値(戻り高値)を抜けるまでは、集団心理的には「まだ上目線だ」と見られています。
ネックラインを抜けて「反転するかも?」というムードになり始めても、ネックライン抜けを「安いレートで買いエントリーができるチャンスだ」と思うトレーダーも、まだまだいる状況なのです。
ですから、大きな時間足チャートのラインとの位置関係をしっかり把握した上で、ダブルトップ・ダブルボトムでのトレード戦略を立てていくことが大切になります。
注目すべきは、パターンの「見た目」ではなく「集団心理」
もっとも重要なことは、パターンが形作られていくプロセスの中で、相場参加者たちの集団心理がどのように変化していくのかに注目することです。
- 買いポジションをもっているトレーダーは、どのラインを抜けたら不安や恐怖を感じるだろうか?
- どのラインを抜けたら、恐怖でガマンできなくなって買いポジションを手放す(損切りする)だろうか?
──こういったことを考えてみることが重要なのです。
テクニカル分析では、パターンの「見た目」だけを気にしていては重要なことは分かりません。
みんながトレンドに乗っていてイケイケだった集団心理が、「あれ?」と感じ始め、「これはマズいぞ……」となって、「こりゃもうダメだ!助けてくれ!」と恐怖に襲われる、そのポイントを読み取っていくのです。
これがダブルトップ・ダブルボトムという反転パターンの使い方です。
以上、『ダブルトップ・ダブルボトム』の意味とトレード方法とは?相場心理を読む──について、お伝えしました。
次回予告
次の記事では、ヘッドアンドショルダー(三尊天井)について取り上げます。
この反転パターンについても、今回のダブルトップ・ボトム同様に集団心理を追いながら、トレード方法とあわせて解説していきます。
それでは、下のリンクからどうぞ。
■次はこちらの記事をどうぞ。
>>『ヘッドアンドショルダー(三尊天井)』とは?その意味とトレード方法
こちらの記事もおすすめです