ダウ理論をつかって目線を定め、為替相場の状況変化に応じて目線を切り替えていくことは、FXのテクニカル分析(チャート分析)の基礎となる重要なスキルです。
「ダウ理論」とは、相場の値動きを分析して取引を判断するための理論です。
前回の記事では、チャートの値動きを判断するための基礎として、「トレンド状態」と「レンジ状態」の2つのパターンに分けて考えることを知ってもらいました。
今回は、その2つのうちの「トレンド」について、とても役立つ法則「ダウ理論」を使いながら、トレンド状態を明確に判断して目線を切り替えていく方法について解説します。
前回の記事を読んでいない場合は、下のリンクからご覧ください。
解説記事 FX相場の状況をトレンドとレンジの2つに分類する方法とは?
トレンドについての「明確な基準」をもつ必要がある
テクニカル分析の初歩である「トレンドとレンジの見分け方」は、知識としてはもうアタマに入っていると思います。
しかしそれを「実際の動く為替チャート」で判断できるようになるためには、それだけでは不十分です。
あなたは今のところ、止まったチャートの「過去も未来もよく見えている状態」では、トレンドもレンジもそれなりに判断できるでしょう。
しかし、リアルタイムで為替レートが動く実戦の場では、それではまだまだ役に立ちません。
値動きの未来が分からない状態で、その場で明確な「自分なりのテクニカル分析」が出来るようになるためには、トレンドについての「明確な基準」をもつ必要があります。
トレンドには上昇と下降の二種類がある
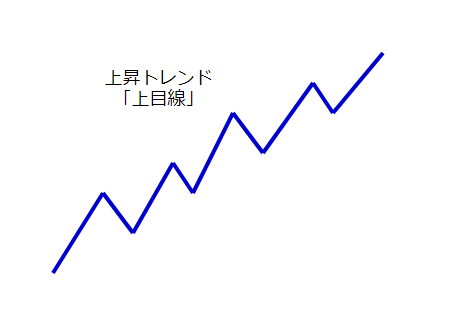
前回の復習になりますが、チャートの値動きに方向感がある状態を「トレンド状態」といい、それはパッと見て、「ああ、上へ動いているな(下へ動いているな)」と分かるものでした。
「上へ動いている」状態を「上昇トレンド」といい、目線を上に定めていることから「上目線」ともいいます(株式相場などでは「買い目線」とも呼ばれます)。
「目線」とは、今のチャートに対して「自分は買いと売りのどちらが有利と捉えているか?」を示すものです。詳しくは、後ほど解説します。
そして、反対に「下へ動いている」状態を「下降トレンド」といい、同じくこれも「下目線」といいます(同じく「売り目線」とも呼ばれます)。
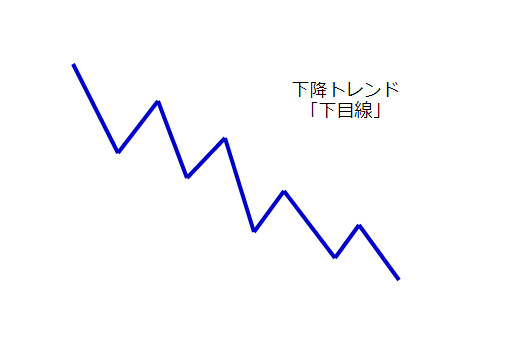
トレンド状態には、このように「上昇トレンド」と「下降トレンド」の二種類があります。
基本的にトレンドには、この二種類しかないのですが、実際のチャートでは判断が難しい「ややこしい場面」が続出します。
「上昇?下降?それとも?」トレンド判断に迷うケース
「つまり値動きに方向感があるかどうかを見て、それが上か下か判断すればいいんでしょ?」と、あなたは「簡単だな」と思っているかもしれません。
しかし実際のチャートでは、判断に迷う場面がいくらでも現れます。
例えば、こういう状況だったらどう判断しますか?
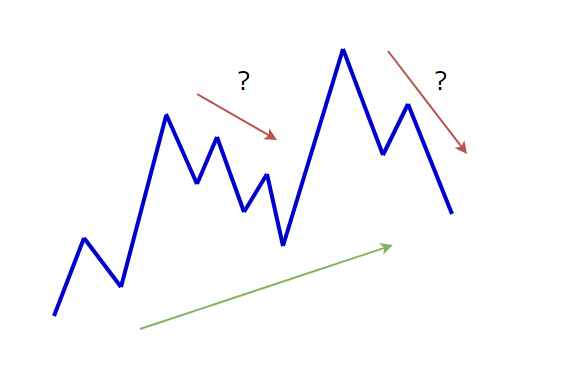
「パッと見たところ、方向感は上だと思うけど、真ん中と最後ではレートが下がっていってるぞ……」
では、これはどうでしょうか?
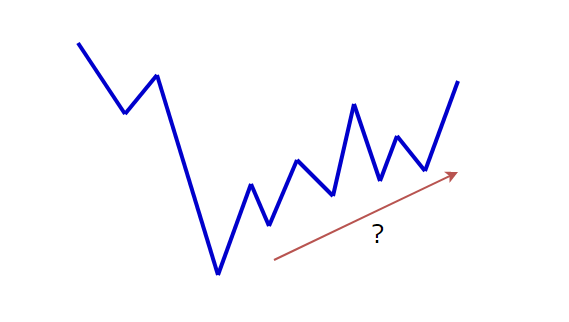
「大きく下げてきたんだから、そこの値動きは下降トレンドだと思うけど、そのあとは上昇し続けてるから、上昇トレンド?」
どうでしょう、判断に迷いますよね?
そして実際のテクニカル分析の現場では、このようなトレンド判断に迷うケースの方が圧倒的に多くなってきます。
トレンド判断の強い味方「ダウ理論」登場
こうした相場状況でのトレンド判断の問題において、強い味方になってくれるものがあります。
それが「ダウ理論」です。
ダウ理論を用いることによって、トレンドの判断に明確な基準をもつことが可能になります。
いま見たような、トレンド判断に困る場面でも、現在が上昇トレンドか下降トレンドなのか、それともトレンドが終わった状態なのかを判断できるようになるのです。
そうなれば、買いか売りか、今どちらの方向へトレードするのが優位性が高いのか、その判断が出来るようになります。
この「優位性の高い方向の判断」のことを「目線を定める」といいます。
この「目線」は、相場状況の変化に応じて切り替えていく必要があり、これを「目線の切り替え」といいます。
そしてこれは、トレード戦略を立てる上での重要事項になります。
ここからは、ダウ理論を使ったトレンド判断の理解を通して、目線を定めたり切り替えたりしていく方法を解説していきます。
ダウ理論の6つの法則
さて、ダウ理論は6つの法則から構成されていて、それぞれに意味があります。
しかし実際のFXトレードにおいては、その内のいくつかを理解しておけば問題ありません。
ダウ理論の6つの法則
- 平均はすべての事象を織り込む。
- トレンドには3種類ある。
- 主要トレンドは3段階からなる。
- 平均は相互に確認されなければならない。
- トレンドは出来高でも確認されなければならない。
- トレンドは明確なシグナルが発生するまでは継続する。
これだけを見ると「何がなんだか分からない」といった雰囲気がありますが、これから噛みくだいて解説していきますので安心して下さい。
FXトレードで重要になってくるのは1、2、3、そして6番目の法則ですので、それらを順に説明していきます。
ダウ理論1.「平均はすべての事象を織り込む」
「平均ってなに?」と思いますよね?
これは、「チャート上にあらわれるレート(値動き・価格)そのもの」のことです。
といっても、恐らく「?」だと思います。
FXの場合、経済指標の発表や大事件、要人の発言、様々なニュースなど、世の中のあらゆる出来事が要因となってレートが動いています(これを「ファンダメンタルズ」といいます)。
ならば、そういったあらゆる出来事を踏まえてトレードしなくてはいけないのかというと、そうではないのです。
何かの出来事が原因となって、「買いだ!」「売りだ!」と人々の思惑が生まれるわけですが、そもそも、それをあなたが知ることは不可能なことですし、そんなことを知ろうとする必要もありません。
なぜなら、そうした人々の思惑がどういうものであるにせよ、その思惑から生まれた売買行動は、すべて値動きとしてチャート上にハッキリとあらわれるからです。
つまり、相場参加者の本音は、値動きとしてチャート上に包み隠さず表示されているのです。
大口トレーダーたちが何らかの思惑をもって実際に売買行動を起こしたなら、必ず為替レートの変動としてチャートに記録されるということです。
あなたは、そうやってチャートにあらわれた「人々の思惑の真実の姿」を利用すればいいのです。
そしてこのことを示しているのが、ダウ理論の『平均(価格・値動き)はすべての事象を織り込む』なのです。
つまりダウ理論は、「値動き・レートそのものが、相場参加者すべての人々の真実の姿をあらわしているんだよ。だから、チャートがすべてだよ」と教えているのです。
ダウ理論2.「トレンドには3種類ある」
「あれ?トレンドは上昇と下降の二種類じゃないの?」と思ったなら、あなたは鋭いです。
ダウ理論でいうところの「3種類のトレンド」とは、それとは別のものです。
「上昇・下降トレンド」が「トレンドの方向のこと」だとするなら、「3種類のトレンド」とは「トレンドの規模・サイズのこと」だと思って下さい。
つまり、こういうことです──
日足チャートが上昇トレンドになっていたとします。
そのチャートを15分足にしてみると、日足では上昇トレンドだった部分が、15分足では上昇トレンドと下降トレンドとレンジが、入り混じった状態になっていることが分かります。
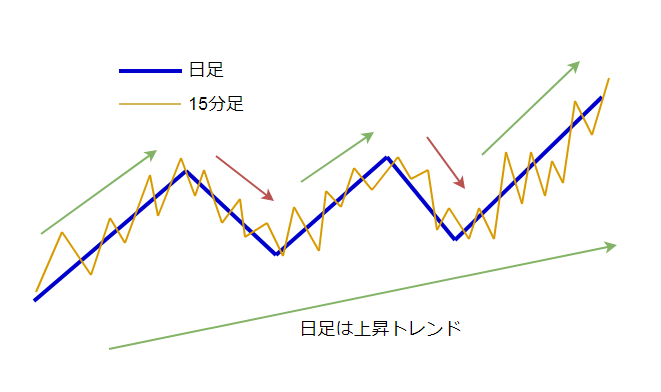
つまり、各時間足ごとに個別のトレンド状態があるのであり、大きなトレンドの波の中に、中規模の波が、さらにその中に小規模の波が入っているのです。
ダウ理論では、これを「3つのトレンド」と呼んでいるのです。
あなたが見ているチャートが1時間足だったとしましょう。
そのとき「1時間足はレンジだけど、日足では上昇トレンドだな」とか、「1時間足は上昇トレンドだけど、5分足では下降トレンドだぞ」という風にチャートを見ていくことが、優位性のあるトレードをする上でとても重要になってくるのです。
ダウ理論3.「主要トレンドは3段階からなる」
また出ました「3」。
3段階とは、どういう意味でしょう?
これは、ひとつのトレンドが始まりそして終わっていく過程で、3つの特徴的な段階が見られることを示したものです。
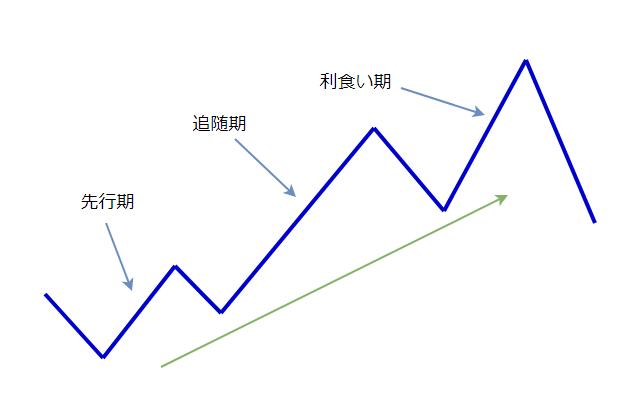
「先行期」とは、「そろそろトレンドが始まるだろう」と思惑をもったトレーダーたちの売買によって作られる、トレンドの初期状態です。
「追随期」とは、「トレンドが始まったぞ!」と判断したトレーダーたちが、次々と相場に参加してきている状況です。
この辺りで、誰が見てもトレンド状態だと分かるチャートになってきます。
「利食い期」とは、「どう見てもトレンドだ! 乗り遅れたくない!」という後追いトレーダーたちが遅れて参入してくる時期です。
また、「利食い期」は先行期や追随期でポジションをもっていたトレーダーたちが利食い(利益確定)をする時期でもあります。
その後は、利食いの売り注文や、遅れて参入したトレーダーがトレンドに乗れずに決済する「損切り注文」が合わさり、レートは大きく下落していき、一旦トレンドが終了する状況が生じます。
ここでは詳しく理解しようとするよりも、「トレンドは、あやふやな時期から始まって、だれが見てもトレンドだと分かる時期を経て、最後にひと盛り上がりして、そして終わっていくんだな」とイメージを持ってもらえれば十分です。
ダウ理論6.「トレンドは明確なシグナルが発生するまでは継続する」
4番目と5番目は、今回の内容とは直接的な関係はないので、解説は割愛します。
さて、この6番目がダウ理論ではもっとも重要なもので、他の5つは忘れたとしても、これだけは忘れないで欲しいとても重要なポイントになります。
トレンドはいつまでも永遠に続くものではありません。
いつかは終わり、値動きは停滞し、レンジになったりレートが反転していったりします。
トレードをしていて悩ましいのは、「今はトレンド状態なのか?」を判断することです。
そしてトレンド中の場合は「いつトレンドが終わったと判断すればいいのか?」が問題になります。
これらの悩ましい判断を助けてくれるのが、ダウ理論の6番目の法則『トレンドは明確なシグナルが発生するまでは継続する』なのです。
その「明確なシグナル」を理解することで、現在トレンドがどういう状態なのかを判断できるようになります。
では「明確なシグナル」を理解していくために、順を追って解説していきましょう。
ダウ理論におけるトレンドの定義とは?
まずはトレンド状態をハッキリと定義しておきましょう。
トレンドの定義もダウ理論で明確になっていますので、初めにそれをお伝えします。
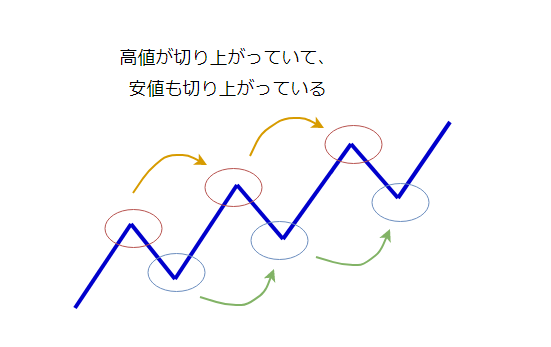
高値が切り上がっていて、それと共に安値も切り上がっています。この条件を満たす値動きのことを上昇トレンドと定義します(下降トレンドはこの逆)。
つまり高値と安値が切り上がり続ける限りは、上昇トレンドは継続していると判断するわけです。
「切り上げ」の判断方法──
高値の切り上げは、高値更新をした時点で「高値が切り上がった」と判断できます。
安値の切り上げは、新たに高値更新したときの直近の安値(谷の底にあたる安値)がその前の安値(その一つ前の谷の底)を上回っていれば「安値が切り上がった」と判断できます。
「切り下げ」の判断方法──
安値の切り下げは、安値更新をした時点で「安値が切り下がった」と判断できます。
高値の切り下げは、新たに安値更新したときの直近の高値(山の頂上にあたる高値)がその前の高値(その一つ前の山の頂上)を下回っていれば「高値が切り下がった」と判断できます。
つまり、高値と安値の切り上げは「高値更新したタイミング」で判断し、切り下げは「安値更新したタイミング」で判断することになります。
これが明確で基本的な「切り上げ・切り下げ」の判断方法になります。
文章だと難しく感じるかもしれませんが、先程の切り上げの図を見ながら読み返してもらえれば、簡単に理解できると思います。
このようにダウ理論では、「高値と安値がどうなっているのか」に注目して、トレンドの状態を判断していきます。
あらためて、下記の図を見てみると、ダウ理論のこの定義に当てはまっていることが分かります。
トレンドの「明確なシグナル」とはなにか?
トレンドにおいて重要なのは「高値と安値がどうなっているか(高値と安値の推移)」であることが明らかになりました。
ということは、この高値と安値を見ていけば「トレンド状態」なのか、それともトレンドの継続に黄信号がついて「トレンドが一旦終わった状態」なのか、さらには「反対方向のトレンドが始まった状態」なのかが判断できるわけです。
そこでまず注目してほしいのが、「最高値のひとつ前の安値」と「最安値のひとつ前の高値」です。
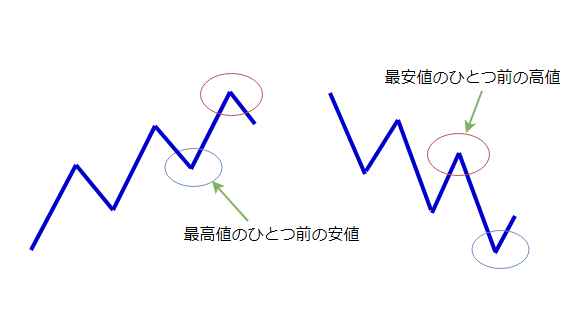
「最高値のひとつ前の安値」を下抜けたり、「最安値のひとつ前の高値」を上抜けたりすることは、「高値と安値が切り上がっている状態、もしくは切り上がっている状態」が崩れることになります。
つまり上昇もしくは下降するトレンドの定義から外れることになります。
ですからそれは「トレンド状態ではなくなった」ことを示しているのです。
ですから「最高値のひとつ前の安値」と「最安値のひとつ前の高値」は、トレンド判断の上で大変重要なポイントになります。
この重要ポイントにはちゃんと名前があり、それぞれ「押し安値」と「戻り高値」と呼ばれています。
この「押し安値」と「戻り高値」をレートが抜けると、トレンドの定義から外れるため、それまでの上昇・下降トレンドは終わったことになり、さらにはトレンド転換する可能性が生じます。
では、ダウ理論のトレンドの定義に従って、トレンドが転換していく様子を見てみましょう。
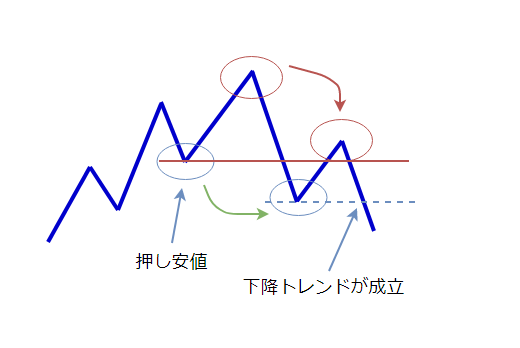
上の図を見ると、上昇トレンドの押し安値を下抜けて安値が切り下がり、さらにその安値を下抜けして明確に高値を切り下げたタイミング(青点線の下抜け)で、下降トレンドへと転換した様子が分かります。
まず上昇トレンドの場合、押し安値をレートが下抜けたらそこで上昇トレンドは終わりになり、これがダウ理論のいう、トレンド終了を示す「明確なシグナル」です。
ただ注意しておきたいのは、押し安値を下抜けても、安値を更新して明確に高値を切り下げない限りは(上昇トレンドは終わっているものの)、まだ下降トレンドにはなっていない点です。
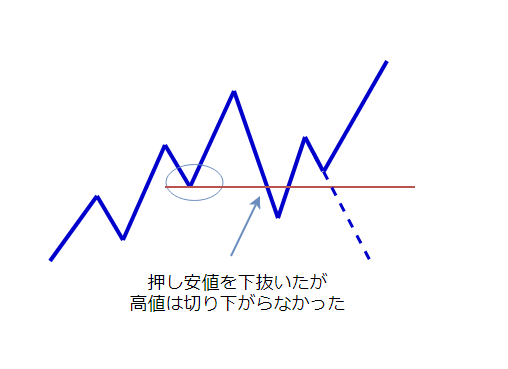
上の図では押し安値を下抜け、一旦は上昇トレンドが終了しました。
しかし、この時点では(押し安値を下抜けて出来た)安値は下抜けておらず、まだ高値は明確には切り下げていませんので、「新たに下降トレンドが始まった」とまでは判断できません。
この状況では、上昇トレンドの定義からは外れてしまっているので、上昇トレンドではなくなっていますが、まだ下降トレンドの定義には当てはまっていないのです。
ですから、まだ上昇・下降どちらのトレンドにもなる可能性がある(上昇トレンドが再開する可能性を残している)と判断できるわけです。
そして上の図ではその後、上昇トレンドが再開してレートは上昇していきました。
ここまで分かれば、あなたにも目線が定められる
ここまでの内容について来てくれたあなたなら、自分で目線が定められるようになるまで、あと一歩です。
目線が定められれば、トレード戦略を立てる上での大きな武器となります。
目線を定めるとは、どういうことか?
ここで改めて「目線を定める」ことについて説明しておきましょう。
「目線」とは、現在のチャートに対して、あなたが買いと売りのどちらが有利だと判断しているかを示すものです。
ですから「目線を定める」というのは、「まだトレンドは継続しそうなのか?」「トレンドが転換しそうなのか?」を判断して、買いと売りのどちらの側に立つのかを決めるということです。
あなたがチャートを見て、何らかの理由で「買いが有利だ!」と判断したなら、その時あなたは「上目線(買い目線)に定めた」ということです。
そして、その何らかの理由として有効なのがダウ理論なのです。
ダウ理論をつかって目線を定める方法
ダウ理論を使った目線の定め方はシンプルです。
高値と安値が切り上がっていて上昇トレンドなら、押し安値を下抜けるまでは「上目線(買い目線)」です。
レートが反転してきて、押し安値を下抜けたら「上目線」をやめます。
もっとも早い判断としては、ここで早々に「下目線」へ切り替えていきます。しかし、まだ「高値の切り下げ」は起きていないので、下降トレンドになったわけではありません。あくまでも「目線を下に定めた」ということです。
押し安値の下抜けで「下目線」にする理由
このタイミングで目線を下に定める理由は、以下の通りです。
まず、押し安値を下抜けたことによって、相場参加者の集団心理は次のようになると考えられます。
- 買いポジションをもっていたトレーダーたちは、トレンドが始まって以来初めて安値が切り下がったことに状況の変化を見て取り、不安を感じ始めるでしょう。
「このままレートが下落するのではないか?」と心配し、決済の売り注文を出し始めます。 - 売り勢力は、これまでに無かった値動き(安値の切り下げ)をきっかけに「これをチャンスに売っていこう!」と考え、新規の売り注文を出し始めます。
このように、売り買い両方の思惑が「売り」で一致しやすくなる場面だと考えられますので、まだ下降トレンドにはなっていないものの、目線を下に定めてトレードの機会をうかがおう──という意図があるのです。
その後、実際に高値の切り下げが起きて下降トレンドが始まったなら、そこからはトレンド方向と一致した明らかな「下目線」だと判断していけます。
もちろんこれが絶対の判断方法なのではなく、多様な判断基準をもった大小様々なトレーダーたちがいると思われます。
それに、上位の時間足チャートの状況に応じて、場面によっては判断を調整する必要も当然あります。
あくまでも基本的な判断方法のひとつですが、値動きの傾向に沿った妥当な判断のひとつであることは確かです。
ダウ理論を使って、目線を定める実践をしよう
では、目線を定める方法を使って、一緒に売買の目線を定める実践をしていきましょう。
この記事の始めに取り上げたチャートを使いながら、順番に上目線(買い目線)なのか下目線(売り目線)なのかを判断していきましょう。
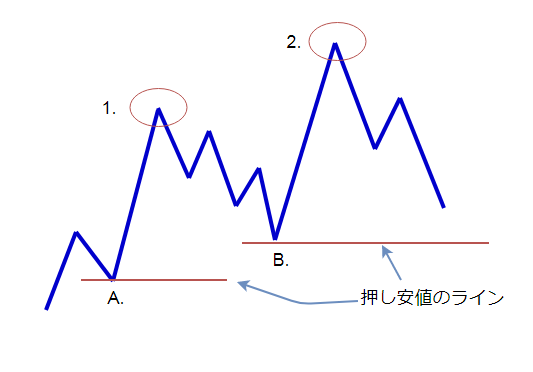
左側から順に見ていきましょう。
高値「1」をつけた時点で、高値と安値を切り上げ続けていて、上昇トレンドが継続していたとします。
高値「1」が最高値になったとき、そのひとつ手前の安値は「A」ですので、この安値「A」がこの時点での「押し安値」になります。
この押し安値「A」を下抜けるまでは、上昇トレンドは継続中と判断でき、「目線は上目線である」と定めることができます。
「上目線?下目線?」と迷う場面
高値「1」からは、下へジグザグと下降しています。
ここで、「高値と安値を切り下げているから、下降トレンドではないの?」と思うかもしれません。
ここで思い出してください。
ダウ理論によるトレンドの定義は「高値と安値が切り上がって(切り下がって)いること」でした。
しかしそれと共に「明確なシグナルが発生するまでは、トレンドは継続する」のでした。
そのシグナルが発生するのが、最高値のひとつ前の安値=「押し安値」を下抜くことです。
ということは、押し安値「A」を下抜けない限りは上昇トレンド中だと判断しますので、このジグザクとした下降の場面でも「目線は上目線」となります。
ここまでくれば、もう大丈夫
その後、安値「B」ができてから一気に上昇し、高値「2」をつけました。
その時点で、ひとつ前の安値「B」が新たな押し安値になります。
そして高値「2」から、またジグザグとレートが動いて高値を切り下げています。
これも先ほどの場面と同様の値動きですから、目線はすぐに定められるはずです。
押し安値「B」よりも上にレートがありますから、ここも「上目線」と判断できます。
結局このチャートでは、ずっと上目線だったのです。
一見すると、ジグザグと上下に動いているように見えますが、トレンドは上昇し続けていて、トレードするに当たっては上目線──つまり、買いトレードのチャンスを狙うことが有利な状況だったわけです。
目線の切り替えが必要なケース
もうひとつ、別のチャートをつかって、目線を定める実践をしてみましょう。ここでは、目線の切り替えについて見ていきます。
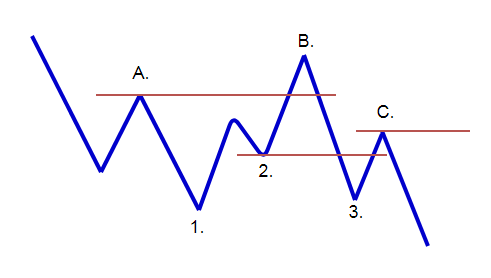
左側から下降トレンドが続いていたとします。
安値「1」の時点では、戻り高値は「A」となっているので、この高値を上抜けるまで目線は「下目線」です。
その後、レートは戻り高値「A」を上抜いて、高値「B」をつけました。
この時点で下降トレンドは一旦終了したと判断し、下目線だった目線を上目線に切り替えます。
先ほどお伝えしたように、ここで注意しなければいけないのは、この時点では「これから上昇トレンドやレンジになるかもしれないし、下降トレンドが続く(再開する)かもしれない」という、「値動きがどうなるか分からない状況」だという点です。
あくまでも「いったん下降トレンドが終了した」のであり、この後、再び下降トレンドが再開する可能性は残っている状況です。
今はトレード戦略を立てる上で「早い段階で上目線に定めて買いを狙っていこう。でもまだトレンド転換はしていないので無理なホールドはしないでおこう」──と判断しているということです。
さて、高値「B」をつけた時点で目線を「上目線」に切り替えました。そしてひとつ前の安値「2」を押し安値と判断して、水平線(ライン)を引いておきます。
この押し安値の水平線(ライン)を下抜けたら、また目線は下に切り替えます。
その後は図のように押し安値「2」を下抜けていきましたので、これでまた目線は「下目線」に切り替わりました。
そして安値「3」をつけたレートは、そこから更に高値「C」をつけ、安値「3」を下抜けた時点で高値と安値も明確に切り下がり、下降トレンドが再開していきました。
目線を定めたり、切り替えるときの注意点
まず理解してもらいたいのが、目線の定め方や目線の切り替え方には、数学的な「公式」や「正解」は無いという現実です。
私たちトレーダーは、どうしても「これが正解。こっちへいくはず!」という思い込みに囚われてしまいがちです。
未来が分からない相場の世界では、そうした正解を求めたくなる気もちは自然なものです。
しかし大切なのは、「相場に参加している他のトレーダーは、このチャートをどう見ているのだろうか?」と考えることです。
つまり、大口トレーダーを中心とした相場参加者の集団心理をイメージすることです。
一目瞭然で上昇トレンドだと見えるなら、それは他のみんなもそう見ている可能性が高いでしょう。
ということは逆に、あなたが目線に迷うチャートでは、他のみんなも迷っている可能性があるのです。
ですから、難しい場面では目線の判断を保留しておいて、その後、分かりやすい高安値の切り上がり・切り下がりが現れてから、落ち着いて目線を定めれば十分なのです。
だれが見ても重要だと思える目立つ高値・安値を抜けて切り上げや切り下げを作ったら、そこで自信をもって判断すればいいのです。
そして、その判断スキルは(様子見や判断保留も含めて)あなたのトレード経験が増えれば増えるほど的確になっていきます。
ダウ理論を使って目線を定めることの効用
ダウ理論を使って、注目されるであろう高値と安値を基準にして売買の目線を定めることで、あなたのトレードに大きな効果があらわれます。
それは「目先の値動きに振り回されなくなること」です。
例えば「押し安値を下抜けるかどうか」が微妙な場面で、次のような悲劇が防げるようになります。
- 「ブレイクアウトして大きく動くのかな?」「支えられてトレンドが続くのかな?」と迷ってしまう苦痛。
- そんな状況で売りと買いを何度も繰り返して往復ビンタになってしまい、トータルではボコボコに負けてしまう悲劇。
自分なりの確信をもって「こっちだ!」といえるトレードの軸をしっかり持つことで、それと反対方向への値動きに対しては心理的に動じなくなってきます。
また、目線とは反対の値動きに対して「こっちへ動く確率が高いはずなのに、そうならなかったということは……?」と考えられるようにもなります。
そうなると、多くのトレーダーが想定外(サプライズな値動き)だと感じる方向へ、冷静にトレード出来るようにもなっていきます。
ダウ理論によるトレンドの定義と、目線を定めて切り替えていく方法~まとめ
今回はダウ理論をつかってトレンドの状態を判断し、売買の目線を定め、状況に応じて目線を切り替えていくテクニカル分析の方法について、基礎的なところから詳しくお伝えしてきました。
ダウ理論を知ることを通じて、「トレンドの定義」や「トレンドが一旦終了するポイント」、そして「目線の定め方と切り替え方」について、具体的に理解してもらえたのではないかと思います。
今回のまとめ
- トレード戦略を立てる上で、目線を定め、チャート状況に応じて目線を切り替えていくことが大切。
- トレンドを定義して目線を定めるために、ダウ理論をつかう。
- トレンドの定義から外れたら(押し安値・戻り高値を抜けたら)、一旦トレンドが終わったサイン。
世の中の多くの初心者FXトレーダーは、ダウ理論や目線の内容をまったく知らないまま「買いだ!売りだ!」と感情的なトレードを繰り返して退場していってしまいます。
FXにおいては、今回お伝えした「トレンドのこと」「目線を定め、切り替えていく方法」そして「押し安値・戻り高値」の理解が、とても重要なポイントになってきます。
このことは、私の経験からもハッキリといえます。
この先お伝えする内容も、今回のことを踏まえていきますので、出来れば何度も読み返して理解を深めていって下さい。
そしてあなたの目でチャートを分析して、押し安値と戻り高値を見つけたり、トレンドが始まりそして終わっていく様子を観察して欲しいと思います。
以上、『ダウ理論』とは?トレンドを定義して目線の切り替えをする方法について、お伝えしました。
次回予告
次回は、テクニカル分析をしていく際に欠かせない「水平線(ライン)」の解説と、その引き方についてお伝えしていきます。
それでは、下のリンクからどうぞ。

参考リンク
関連情報 ダウ理論の説明: ダウ理論とは何か、どのように機能するのか(英語)
こちらの記事もおすすめです