
「トレード手法を作っているけど、なかなか勝てるルールが出来ない……」
もしかしたらそれは、トレード手法の作り方が間違っているからかもしれません。
今回は、FXのトレード手法作りに悩んでいるあなたに、トレード手法の重要部品であるセットアップの作り方について、詳しく実践的に解説していきます。
この記事を読むことで、FXの値動きの優位性をルール化していく実際の様子が分かり、あなたもトレード手法の重要部品を作れるようになるでしょう。
セットアップとは?
セットアップとは、FXのトレード手法を構成する要素のひとつで、トレードに相応しい状況を特定するための“条件”をまとめたものです。
正確には「セットアップルール」と呼びます。
簡単にいうと「どんな場面でトレードするのか?」を定めたルールが、セットアップです。
相場環境を認識して、背景分析をおこない、トレード戦略を立てる──こうしたFXでの一連のトレード判断をルール化したものといえます。
FXでは、条件が満たされてトレードが可能になった状態のことを、「セットアップが成立した」「セットアップが整った」「セットアップが満たされた」などと呼びます。
実際のトレードでは、セットアップが成立したら(条件が満たされたら)、続いてエントリータイミングの条件が満たされるかどうかを見極めることになります。
この「エントリータイミングの条件」が成立したらポジションを持つわけですが、この条件のことは「トリガー(トリガールール)」と呼びます。
この記事では、これらトレード手法の要素の内、重要な“セットアップ”について解説を進めていきます。
なおトリガーについては、下の記事で詳しく解説していますので、今回のセットアップの記事とあわせて読んでみて下さい。

FXのトレード手法を構成する要素は数多くある
セットアップについて詳しくお伝えしていく前に、FXのトレード手法全体について少しおさらいしておきましょう。
FXのトレード手法というと、一般には「どこでエントリーするか?」ばかりが注目されがちです。
しかしエントリーに関するルールは、FXのトレード手法を構成する要素のひとつに過ぎません。
エントリールールの他にも、為替相場の環境認識や背景分析のルール、利食いと損切りに関する「決済ルール」、リスクマネジメントに関する「ポジションサイズルール」などがあり、それらは皆、お互いに関係し合っています。
さらにいえば、トレード手法とはチャート上でエントリーや決済をすることだけに留まりません。
トレードする環境や時間帯のこと、トレード中のセルフマネジメント(自己観察やメンタル管理)のこと等、多岐に渡るものなのです。
下の記事では、そうした「エントリーや決済“以外”」のFXでの大切なルールについて解説していますので、FXのトレード手法作りに役立てて下さい。

今回解説する「セットアップ」は、先程も説明したように、こうしたFXのルール全体のなかの相場環境認識や背景分析ルールに属するものです。
いうなれば「エントリー前のお膳立て」をするためのものだ、ということを踏まえておいて下さい。
FXでセットアップを用いるメリット
さて、セットアップとはFXのトレード手法を構成する要素のひとつであり、実際にポジションを持つ前の段階で用いられ、現在の相場状況がトレードに相応しいかどうかを判断するためのルールです。
別の言い方をするなら、セットアップの条件が満たされない限りはトレードしないということです。
“セットアップ”というと何か特別なルールのように感じるかもしれませんが、実は普段のFXトレードで既に馴染みがあるかもしれません。
例えば、次のようなシンプルなトレード手法(エントリールール)があったとします。
- 日足の25MA(移動平均線)が上昇していて、
- レートが日足のMAより上(ブルの位置)にあったら、
- 1時間足のMACDのサイン(ゴールデンクロス)でエントリー。
この場合、(1)の「日足の25MAが上昇」と、(2)の「レートがブルの位置」がセットアップに該当します。
つまり、まず「日足の条件が満たされているか」が大事なポイントになっていて、日足の条件が整わない限りは、いくら1時間足でサインが出てもトレードしない、というセットアップになっています。
このようなセットアップがあるお陰で、目先の値動きに振り回されて無駄なエントリーを繰り返してしまう、そんな「よくある失敗」を避けることが出来ます。
これがFXトレードでセットアップを用いる大きなメリットの一つです。
もし先程のシンプルなトレード手法に、日足に関するセットアップが無かったらどうなるでしょう?
1時間足のMACDばかりを目を皿のようにして見続け、MACDのサインが出るたびに買ったり売ったりを繰り返してしまい、大抵はトータルで損失を出してしまう結果に終わることでしょう。
FX初心者あるあるのひとつである「ポジポジ病」の原因は様々ですが、その大きな要因として、どれもこれもエントリーチャンスに見えてしまうというものがあります。
セットアップを明確にすることによって「ここはエントリーポイントではない」という判断基準を持つことが出来るので、ポジポジ病を軽減できる確率が上がります。
つまりセットアップを明確にして背景分析をしておくことで、集中力を維持しながらどっしりと構えて、優位性のあるトレードタイミングを見極めていくことが可能になるわけです。
そしてセットアップが成立したなら、そこからはエントリーに集中することが出来ますから、トレードすべきかどうか迷い続けるような事態にも陥らなくて済むのです。
セットアップの基本的な考え方
セットアップとは「自分はどういうチャート状況でトレードするのか?」を明らかにしたものです。
あらかじめ「こういう相場環境なら、買いでトレードすることに優位性がある」という場面を特定しておくことで、長期的にブレないFXトレードを繰り返していけるようになるわけです。
そこで疑問となるのが「優位性のある状況」とはどういうものなのかです。
答えから言うと、優位性のあるチャート状況とは「多くのトレーダーの行動が、売りと買いのどちらか一方に偏(かたよ)る状況」のことです。
解説記事 FX『優位性』とは?トレード手法の実例とその作り方を解説
そのような相場状況をセットアップルールで条件付けしていきます。
優位性のある状況を再現性のあるルールで明確化して、その条件下でのみエントリーすれば、基本的に繰り返せば繰り返すほど利益が残りやすくなるわけです。
いきなり正解を求めようとしない
このような話をすると、初心者トレーダーを筆頭に「じゃあ、その優位性のある相場状況を知りたい!」といって、いきなり正解を求めようとしがちです。
確かに為替相場の一般的な傾向として、優位性のある状況というものはあります。
しかし、チャート上の優位性を活かして実際に利益を生み出すには、トレード手法の他のルール(トリガーや決済などのルール)との兼ね合いが大きく関わってきます。
ですから、まずはセットアップに優位性があるかを検証し、そこからトレード手法としてまとめ上げたものを使って、さらに検証していく必要があります。
こうした検証プロセスをすっ飛ばして「正しいセットアップ」を追い求めてしまうと、いわゆる「聖杯探しの罠」に陥ってしまうので注意しましょう。
手にしたトレード手法を試してみて、ちょっとでも負けたり上手くいかないと、すぐに他のトレード手法を求めて探し始めることです。
「もっといい手法があるはず」「手法が良ければ勝てるはず」といって、トレード手法の迷宮をさまよい続けてしまうと、いつまでも検証の大切さに気づけませんし、手元にある優れた手法の“原石”の価値にも気づけなくなってしまいます。
「FXの検証」というと、どうしても身構えてしまう人が多いですが、その実態はシンプルな作業の積み重ねですし、特別難しかったり、高い精度が求められるようなものでもありません。
自転車や竹馬のように、転んでいる内に誰でも乗れるようになるものの一つですから、下の具体的な検証方法についての記事を参考にしながら、少しずつ実践してみて下さい。

セットアップの具体例から学ぶ「セットアップルールの作り方」
ここからは、FXの裁量トレードの環境認識・背景分析で用いられる、再現性のある優位性にもとづいた具体的なセットアップを取り上げながら、セットアップルールの作り方について解説していきます。
順番に個々のセットアップ要素を取り上げていき、次にそれら要素を統合していくことについて説明します。
分かりやすく、メジャー通貨のドル円やユーロドルの日足や4時間足チャートを前提にして説明していきますが、実際に用いるチャートの時間軸はどのようなものでも構いません。
環境認識をしていく上で大切なのは、実際にトレードする時間足(執行時間足)とその上位のチャートとの“関係”です。
例えば15分足チャートでトレードするのに、30分足チャートでもセットアップを確認するのは、無駄とはいいませんが、15分足チャートに組み合わせるチャートとしては1時間足や4時間足、そして日足などを用いるのが妥当でしょう。
セットアップの要素①「支持線・抵抗線」
優位性のあるトレード手法におけるセットアップの基本は、売りか買いに偏る状況を特定し、それを再現性のある形で明確化することです。
ですから、セットアップに用いる要素として真っ先に挙げられるのは、支持線(サポートライン)と抵抗線(レジスタンスライン)です。
例えば支持線付近では、買い支えや追随の買いエントリー、さらには売りをしていたトレーダーの利食いなどが起こりやすいとされています。
そこで、この「買い方向への優位性」をセットアップ条件として利用していきます(抵抗線の場合はこの逆)。

「A」は、「レンジ下限では買いに優位性がある」という性質を利用したポイントです。
「B」は、抵抗線を抜けた後、ロールリバーサルによって支持線に変わったポイントです。
「C」は、「B」のポイントを下抜けて、押し安値の支持線に到達したポイントです。
まず、上位時間足──例えば日足で、これらのポイントにレートが到達したら「セットアップが成立した」と判断します。
次に、実際にトレードを執行する時間足チャート(例えば1時間足)で買いトレードを検討します(トリガー条件が満たされるのを待つ)。
支持線・抵抗線・ロールリバーサルのことや、レンジ相場のことについては、以下の記事を参考にして下さい。


下のチャートはユーロドルの日足チャートです。支持線と抵抗線によるセットアップが成立したポイントを赤丸で示してあります。
※クリックすると拡大します。
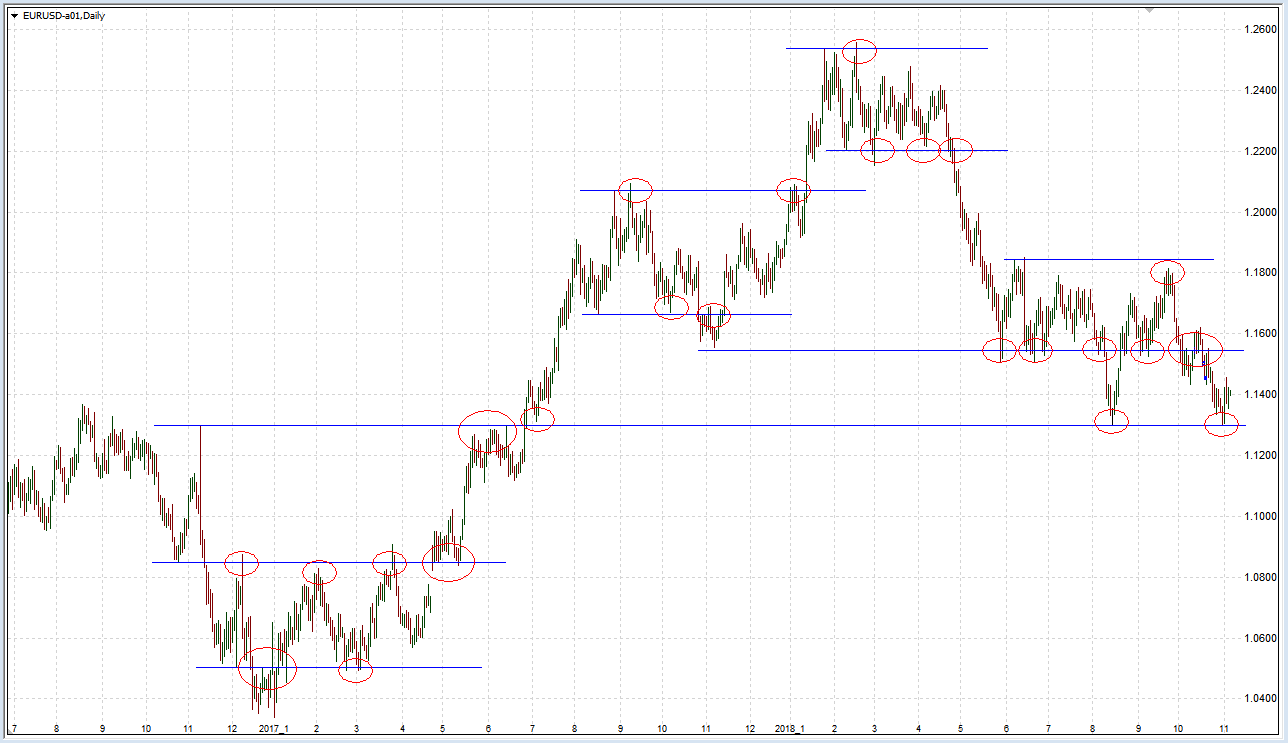
日足の赤丸のポイントにレートが到達した状況で、例えば1時間足で「日足ラインからの反転方向」へトレードすることで、トータルで利益を出せる確率を高めることが可能になります(エントリーには別途トリガールールを用いる)。
しかし言うまでもなく、これは確率的な傾向であり絶対ではありません。
実際のエントリータイミングや決済によって結果は異なってきます(これは全てのセットアップ要素にいえることです)。
さて、こうした上位時間足のチャートでは、細かく見ていけばセットアップが成立したポイントを多々見つけられます。
こうした数々の成立ポイントどの程度まで細かく見ていくかは、各トレーダーの裁量判断になります。
例えばローソク足を拡大した状態のチャートだと、次のようなセットアップのポイントが見えてきます。
※クリックすると拡大します。
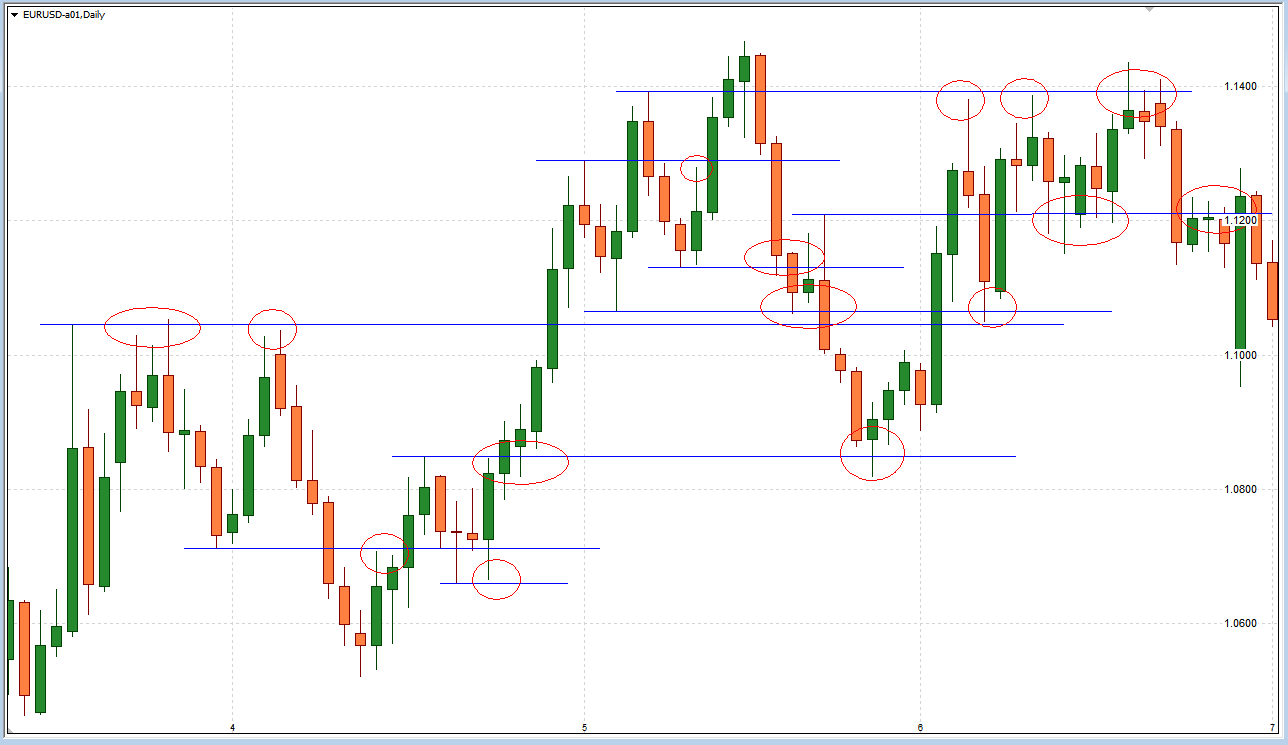
ここで重要なのは、どれだけのトレーダー(大きな資金を動かしている大口トレーダーたち)に注目されているポイントなのか──です。
どんなセットアップでも共通することですが、「このライン(チャートポイント)をみんな(大口トレーダーたち)も認識しているだろうか?」という問いを持つことによって、独りよがりな判断によるポジポジ病を避けることが出来ます。
同様に「トレンドライン」も使える
支持線・抵抗線よりも再現性の面での扱い難さがありますが、トレンドラインもセットアップの要素として利用できます。
その際、基本的には支持線・抵抗線と同様に、ラインでの反転とロールリバーサルをセットアップ条件に用います。
しかし支持線・抵抗線とは異なり、各トレーダーごとの「ラインを引く解釈」に大きなズレが生まれやすくなってきます。
つまり、大勢の市場参加者に注目されていると思われるトレンドラインを引くのが難しいのです。
こうした難点はありますが、逆にいえば、分かりやすいトレンドラインが引けるチャート状況であれば、注目度が高くなることが想定されるため、「セットアップ内の補足ルールとして活用していく」方法が考えられます。
セットアップの要素②「テクニカル指標(インジケータ)」
セットアップの要素として「テクニカル指標(インジケータ)」を用いる場合は、闇雲に色々なテクニカル指標を使っても優位性は得られないので注意しましょう。
世間ではトレード手法について「テクニカル指標こそが手法そのものだ」という考え方が蔓延しています。
しかしテクニカル指標は、あくまでも値動きそのもの(ローソク足)を計算して加工したものであり、値動きの傾向を“見える化”したものです。
つまり極論をいえば、テクニカル指標それ自体に優位性があるわけではないですし、「このテクニカル指標を使えば勝てる」というわけでもありません。
そうしたことを踏まえて、大切なのは先程も述べたように「どれだけのトレーダー(大きな資金を動かしている=相場を動かしている大口トレーダーたち)に注目されているか」です。
例えば、FXで移動平均線を使うのであれば、20期間や25期間、50期間、200期間といった、ポピュラーな設定値のMAを使うのが妥当と考えられますし、MACDを使うのであれば、パラメーターは初期値のままで使うのがおすすめになります。
そして肝心なことは、テクニカル指標にサインを出してもらおうとすることではなく、そのテクニカル指標が捉えようとしている優位性がどういうものなのかを理解しておくことです。
例えば移動平均線を使う場合、単純に「MAが上昇していたら買い」とサインを得ようとするのではなく、「MAが上昇しているということは、そこにどんな優位性があることを示しているのか」を理解して、それを元にセットアップルールを作っていくことです。
移動平均線(MA)をセットアップに使う場合
そもそも移動平均線とは、ある期間の終値の平均値をチャートにプロット(描画)したものです。
20MAであれば、その地点から「過去20期間分の終値」を平均化したレートをラインで結んだものになります。
さて、そこから分かるものは何でしょうか?
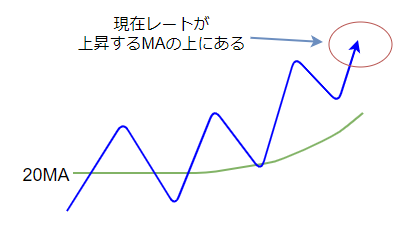
まず、現在レートが20MAよりも上にある(ブルの位置にある)ことから分かるのは、次のようなものです。
現在レートが20MAよりも上にあることから分かるもの
- 過去20期間の間に「買いポジション」を持ったトレーダーの多くは、「含み益」になっている。
- 過去20期間の間に「売りポジション」を持ったトレーダーの多くは、「含み損」になっている。
さらに、20MAが上昇していることから分かるのは、次のようなものです。
20MAが上昇していることから分かるもの
- 売買された平均レートが、期間を追うごとに上昇し続けている。
- 「売るトレーダー」よりも「買うトレーダー」の方が多い状況が続いている。
- つまり、新規の買いや売り方の損切り(=買い)が、買い方の利益確定(=売り)や新規の売りよりも多い状況が続いている。
これらのことから、「上昇している移動平均線の上に現在レートがある場合」には、買いトレードを選択すること(買いポジションを持つこと)に優位性があることが導き出されます。
そのことを元に、例えば次のようなセットアップを作ることが可能になります。
セットアップの例
- 1時間足の20MAが上昇していてレートがMAよりも上(ブルの位置)にある場合は、買いエントリーだけを選択し、売りのトレードはしない。
- 1時間足の20MAが上昇していてレートがMAよりも下(ベアの位置)にある場合は、トレードしない。
この例は、かなり保守的かつ守備的なセットアップですが、トレードに値する相場状況を絞り込む意味では、それなりに価値のあるルールだといえます。
注意点は、セットアップは「エントリーへ向けたお膳立て」であり、セットアップの条件が満たされたからといって、即トレード(エントリー)する訳ではない点です。
実際にエントリーするためは、ここからさらにエントリーの条件(トリガールール」が満たされる必要があります。
繰り返しますが、セットアップはトレード手法を構成する要素のひとつであり、「トレードに相応しい相場状況か」を見極めるためのルールです。
こうして優位性を理解してセットアップを作っていくことが、テクニカル指標を利用する際のポイントです。
「為替レートがMAの上にあるから買いだ」「MAが上昇しているから買いだ」と、単なるサインとして覚えて使うだけではトータルプラスには出来ません。
そんな使い方では、チャートを前にして躊躇したり、うろたえたりしてしまうでしょう。
ちょっとしたMAの動きに翻弄されて振り回され、優位性のない相場状況でトレードを無駄に重ねてしまうのです。
そうならないためにも、テクニカル指標で捉えようとしている優位性(売買の偏り)がどういうものなのか、それをしっかり理解するようにしましょう。
セットアップの要素③「プライスアクション」
プライスアクションとは「FXのレートの動き(値動き)そのもの」のことであり、具体的には「ローソク足の形や組み合わせ」「チャートパターン」を利用していくことになります。
プライスアクションはテクニカル指標とは違って、計算によってレートの動きが加工されておらず、市場参加者たちの売買行動が即座にチャート上に反映されます。
ですからプライスアクションに注目して環境認識をしていくことで、最も素早く状況に対応していくことが可能になります。
こうした優れた特徴があることから、トレード手法の要素がすべてプライスアクションで構成されているケースも見られます。
では、セットアップに用いられるプライスアクションの中から、いくつか特徴的なものを紹介しましょう。
ピンバー(ヒゲの長いローソク足)
ピンバーとは、小さな実体に長いヒゲがついたローソク足のことです。
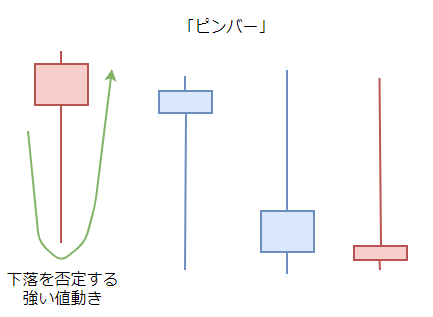
一度は為替レートが大きく上下したものの、そこから強く押し戻されて「最初の値動きが否定された」という事実を表しています。
例えば、長い下ヒゲが現れる「下ヒゲのピンバー」のプライスアクションからは、次のようなことが読み取れます(上ヒゲのピンバーはこの逆)。
「下ヒゲのピンバー」から読み取れるもの
- 一度はヒゲの先端まで勢いよくレートが下落した。
──つまり、強い売り勢力が存在していた。 - その勢いを上回る強い力でレートが押し戻され、上昇した。
──つまり、ヒゲの先端より先には、さらに強い買い勢力が存在している。 - 売り勢力は、あれだけ勢いよく下落した値幅を全て押し戻され、意気消沈している。
──つまり、再び押し返そうというムードになり難い。
このようなことから、下ヒゲのピンバーが現れたら、その後は買いのトレードに優位性があることが分かります。
そしてそのことを元に、例えば次のようなセットアップを作ることが可能になります。
セットアップの例
- 日足で、前日のローソク足に下ヒゲのピンバーが現れたら、当日は買いトレードを検討する。
- 日足が上記「1」の状況のとき、1時間足で上ヒゲのピンバーが現れても、売りトレードはしない。
さらに、このピンバーの他に「包み足」や「はらみ足」「長大線(大陽線・大陰線)」「十字足(同時足)」といったプライスアクション(ローソク足の形)を組み合わせることで、とても効果的なセットアップを構成することが可能です。
それら「組み合わされたプライスアクション」にも、そのようなローソク足が現れた「値動きの背景」があります。
そうした「値動きの背景」を読み取りながら優位性(売買の偏り)を活かしていきましょう。
一例として、ピンバーに「はらみ足」が続いた形のプライスアクションを示しておきます。
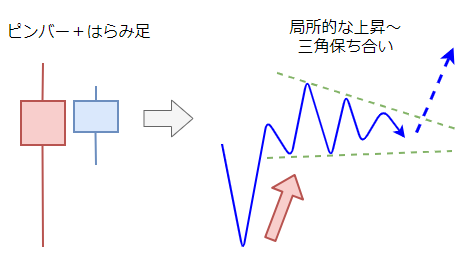
このプライスアクションを分解&拡大してみると、局所的な上昇から三角保ち合いになって「上昇一服」になっていることが見て取れます(図の右側)。
つまりこの後、高値を更新していく値動きになれば、そのまま上昇が継続していく確率が高いと考えられるため、このプライスアクションが現れたなら、買いトレードを検討するのが優位性のあるトレードだと考えられます。
こうしたプライスアクションが学べる本を下の記事で紹介していますので、FXのプライスアクションを掘り下げて学びたい場合は参考にして下さい。

ダブルトップ・ダブルボトム
セットアップに用いられるチャートパターンの筆頭は、何といっても「ダブルトップ」「ダブルボトム」です。シンプルなトレード手法では、このチャートパターンだけを用いたものもある程です。
ダブルトップの場合、前回高値にレートが到達して高値更新をトライしたものの、強い売り勢力に阻まれて反転したことが、この「二つの山の形」として表れています。
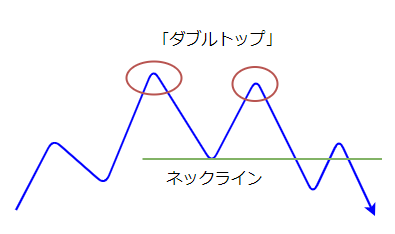
レートがネックラインを抜けた時点で、相場参加者のムードは「もう上昇しないんじゃないか?(反転するかも?)」というものに変わり始める傾向があります。
ダブルトップ形成から再度高値を更新して上昇することもありますが、上位時間足の状況の後押しが無ければ、大抵は反転もしくは一時的なレンジ相場を経ることになりがちです。
ダブルトップ・ダブルボトムに関する詳細については、相場参加者の心理も踏まえながら下の記事で詳しく解説していますので、トレード手法作りの参考にして下さい。

さて、こうした値動きの傾向からは、次のようなことを読み取ることが出来ます。
「ネックライン抜け」から読み取れるもの
- ネックラインを抜けたら、それまでの値動きが継続しなくなる可能性が高まる。
- ネックラインを抜けたら、値動きが反転する可能性が生まれる。
このようなことから、ネックラインを抜ける値動きを使って、次のようなセットアップを作ることが可能になります。
セットアップの例
- 1時間足でダブルトップが形成されてネックラインを下抜けたら、売りトレードを検討する。
- 1時間足でダブルトップが形成されてネックラインを下抜けたら、買いトレードはしない。
このセットアップだけを見ると当たり前のことのようにも見えますが、先程も説明したように、そのプライスアクションの背景と、そこから生まれる優位性を理解することが大切です。
そうすることによって、「多くのトレーダーに認識されているであろうダブルトップ」を見分けたり、反対に「独りよがりなネックライン抜けの判断」に陥ることを防げたり出来ます。
高値と安値の切り上げ・切り下げ
FXトレードのプライスアクションの基本であり、かつ本質といえるのが、この「高値と安値の切り上げ・切り下げ」です。
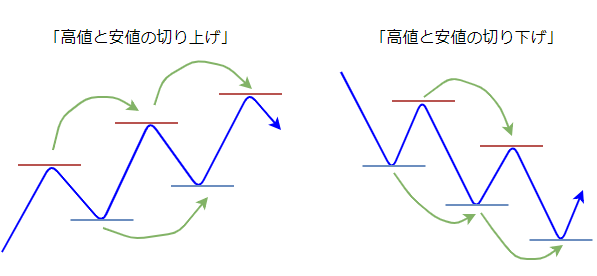
図のように、切り上げ・切り下げが一方向へ続いている状態が、いわゆる「トレンド状態」です。
これは「ダウ理論によるトレンドの定義」として知られているもので、多くのFXトレーダーたちのコンセンサス(共通認識)となっているものの一つです。
ダウ理論によるトレンドの定義
- 上昇トレンド=「高値が切り上がり、安値も切り上がっている状態」
- 下降トレンド=「安値が切り下がり、高値も切り下がっている状態」
もし、ダウ理論とトレンドについて理解があいまいな場合は、下の記事で詳しく解説していますので参考にして下さい。
さて、この高値と安値の切り上げ・切り下げから分かることは、次のようなものです。
「高値と安値の切り上げ・切り下げ」から分かること
- 高値と安値が切り上がったということは、売り勢力よりも買い勢力が強い(売るトレーダーよりも買うトレーダーの方が(人数や資金量が)多い)ことを示している。
- 高値と安値が切り下がったということは、買い勢力よりも売り勢力が強いことを示している。
これらのことから、高値と安値が切り上がっている状況では、買いトレードを選択することに優位性があるといえ、切り下がっているなら売りトレードに優位性があるといえます。
ですので、次のようなセットアップを作ることが出来ます。
セットアップの例
- 1時間足で高値と安値が切り上がっている(ダウ理論的に上昇トレンドと見られる)ならば、買いトレードを検討する。
- 1時間足で高値と安値が切り上がっている(ダウ理論的に上昇トレンドと見られる)ならば、売りトレードはしない。
こうしたセットアップは、他のセットアップ要素を補ったり追認したりするものとしても利用できます。また、複数の時間軸の切り上げ・切り下げがそろうことを条件化することも大変有益です。
さらにはトレード手法の他の要素(トリガーや決済ルール)でも柔軟に適用させられるため、ぜひ普段から高値と安値の切り上げ・切り下げに注目して、その判断に慣れておくことをおすすめします。
それぞれの要素を組み合わせてセットアップを作成する
ここまで、セットアップ要素について色々と見てきましたが、ここからはそれらの要素を組み合わせて、FXトレードの具体的なセットアップを作りながら解説していきます。
これから解説していくセットアップは、優位性を積み重ねた実用的なものではありますが、このセットアップをそのままリアルトレードで使うようなことは決してしないで下さい。
エントリーと決済のルールによって、トータルでの成績は大きく異なってきますし、何よりもまず自分の手で検証を行って、本当に優位性があるのか、そして繰り返していけるのか(再現性は高いのか)を理解して納得するプロセスを経る必要があります。
さて、セットアップ要素を組み合わせて優位性を積み重ねていくとき、大切になる考え方があります。
それは「フラクタル構造」です。
詳しくは下の記事を読んでもらうとして、要するにマルチタイムフレーム分析の考え方を用いてセットアップを作成していこう──というわけです。

FXでは通常、次のようなマルチタイムフレームでセットアップを作成していきます。
- 大きな時間足でのセットアップ。
- 中くらいの時間足でのセットアップ。
- トレードする時間足でのセットアップ。
マルチタイムフレーム分析の詳しい解説は、下の記事をご覧ください。

それでは、まず大きな時間足でのセットアップを見ていきましょう。
大きな時間足でのセットアップの作り方
ここではデイトレードを想定して、日足チャートを大きな時間足として用います。
FXのデイトレードの場合、一見すると日足チャートは関係が薄そうに思えますが、大きな時間足ほど多くの相場参加者の取引が反映されていますから、それだけ注目度が高く、日足のチャートポイント付近では突然大きな値動きが生じたりします。
ですから、こうした値動きの傾向に対して優位性のある行動が取れるように、トレード手法の中にしっかりとセットアップを用意しておくことが重要になってきます。
サンプルとして、次のセットアップをご覧ください。
日足のセットアップ(例)
- 日足の支持線付近にレートが到達したら、売りトレードはしない(抵抗線ではこの逆)。
- 日足の「上昇する20MA」にレートが到達したら、売りトレードはしない(下降する20MAではこの逆)。
- 日足の20MAに方向感がない(横ばい状態になっている)場合、MA付近ではトレードしない。
- 前日にピンバーが現れたら、当日はヒゲの先端方向へはトレードしない。
まだまだ他にも挙げられますが、これら各ルールの特徴は「トレードしない条件」を定めている点にあります。
セットアップでは、「そのチャート状況ではトレードしない」ことを明確にしておくこともまた、優位性を活かすための重要な手段です。
トレードをしても優位性がない(売買の偏りが起こらない)状況や、大きな時間足で反転の可能性がある状況をあらかじめ特定しておくことで、無駄なトレードやリスクの高いトレードを避けられるため、トータルでは損失を抑えられ、利益も残っていきやすくなります。
このように、デイトレードにおける「大きな時間足のセットアップ」では、「トレードしない条件」を定めておくことが、ひとつの有意義なスタイルといえます。
中くらいの時間足でのセットアップの作り方
FXのデイトレードで中くらいの時間足となると、4時間足から1時間足あたりのチャートが該当し、この時間足のセットアップでトレード手法の肝となる「トレードの戦略」を定めていくことになります。
トレード戦略は、トレンドに乗っていくのか(トレンドフォロー)、レンジの中で反発する値動きを取っていくのか(逆張り)といった「大きな枠組み」を定めるところから始まり、その中のどのような場面の値動きを捉えようとするのかをルール化していきます。
そのとき、いきなり「どんな状況でも対応できるようなセットアップ(戦略)」にしようと欲張らないことです。
そのようなコンセプトで作られたセットアップは、複雑怪奇なルールの集合体になりがちですし、そんな手法ではFXの実戦で使いこなすのが極めて困難になります。
最初はトレンドフォローか、レンジ上下限からの逆張りといったシンプルなトレード戦略を、どれかひとつだけセットアップへと仕上げていくことをおすすめします。
ひとつセットアップを作り上げられれば、異なる別のチャート状況に対しても、新しく別のシンプルなセットアップを作ることが出来るようになりますので、これを繰り返して「様々な相場状況に応じた複数のセットアップ」を少しずつ揃えていくようにしてみて下さい。
セットアップの具体例
ここでは4時間足を使ってセットアップを考えていきましょう。
ここまで解説してきた要素をつかって優位性を積み重ねてみた例が、下のセットアップです。
4時間足「買い」のセットアップ(例)
- (必須)4時間足の20MAが継続的に上昇していて、レートがブルの位置にある。
- (補足)陽線が連続して現れた。
- (補足)長大陽線が現れた。
- (補足)下ヒゲのピンバー、包み足、はらみ足が現れた。
- (補足)ロールリバーサルした支持線付近にレートがある。
- ただし、4時間足の抵抗線(前回高値)付近では、買いトレードの検討はしない。
これは4時間足の上昇トレンドを確認して、その流れに「買い」で乗っていこうというトレード戦略です。
ここでは、必須条件を満たした上で、補足条件が一つ以上あればセットアップ成立とみなします。
セットアップ作りのポイント
トレード戦略となるセットアップの作り方のポイントは、戦略の軸となる優位性を明確にしておくことです。
今回のセットアップ例でいうと、「移動平均線から読み取れる優位性」が軸になっていて、そもそもこの条件が満たされない限りは、いくらプライスアクションが好ましくてもトレードしないようになっています。
こうした軸を定めておくことで、実際のトレード中の迷いが減り、トレードに安定感が出やすくなります。
もちろん検証の結果、移動平均線よりも特定のプライスアクションの方が優位性が高いと判断できたなら、そのプライスアクションを軸にしてセットアップを作ればいいわけです。
例えば「特定の状況で現れるピンバー」を優先するセットアップは、一考に値する優位性のひとつです。
実際のチャートで確かめてみる
さて、下のチャートは、実際にこの「買い」のセットアップが満たされた状況を示したものです。
※クリックすると拡大します。
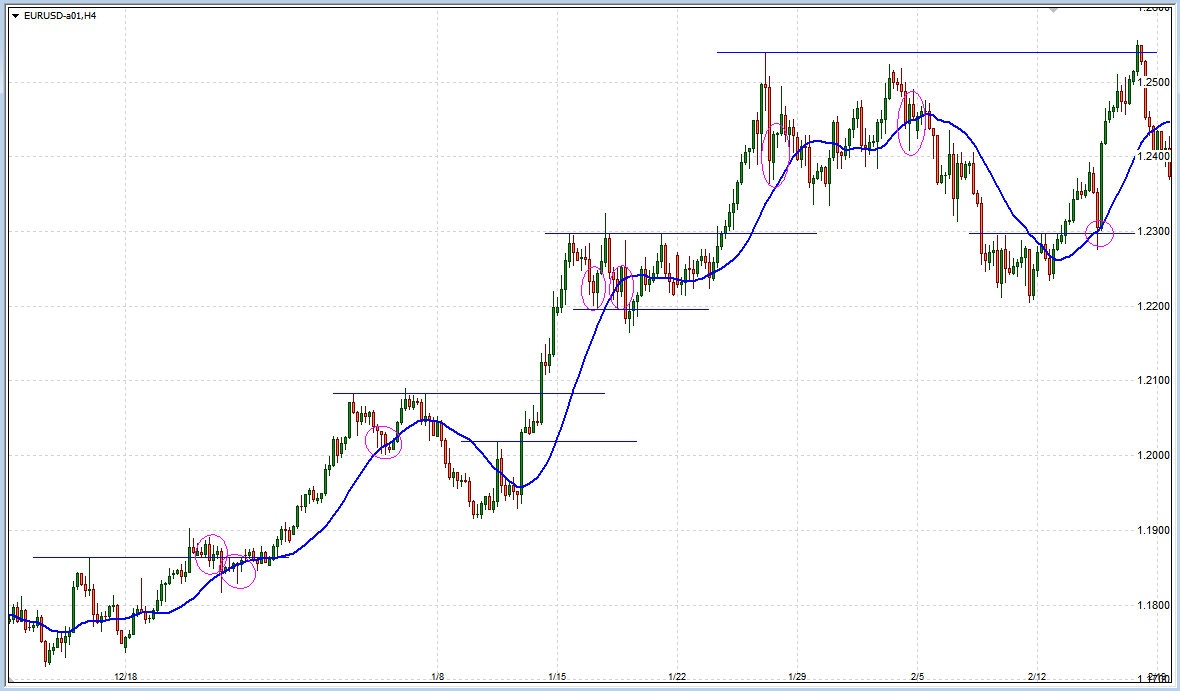
基本的に、20MAが上昇していてレートがブルの位置(MAより上)にあり、そこで陽線が連続したり、長大陽線が現れたところでは、買いのセットアップが成立します。ただし、前回高値付近では様子見です。
調整の値動きによって陰線が続いたり、小さなレンジ状態(保ち合い)になっている場面では、ピンバーやはらみ足などのプライスアクションが現れたり、ラインに支持されたりしたら、買いのセットアップが成立します。
ピンクの丸でマーキングされたポイントは、そうした調整や保ち合いの場面で買いのセットアップが成立したところです。
トレード戦略となるセットアップの重要性と注意点
こうしてセットアップを踏まえながらチャートを見てみると、優位性を積み重ねて買いトレードの状況を絞り込んでいくことによって、トータルで利益を出しやすくなることが分かると思います。
それと共に、そこで売りトレードをするのが危険なことも、自然と理解できるはずです。
もし、トレード戦略となるセットアップが無ければ、この条件下でも、何も知らずに売りトレードをしてしまうことになるのですから、それではトータルで利益を出すことは困難になります。
もちろんセットアップが成立しても、素直には動いていかないケースも多々あります。
しかし、それは確率的に起こり得ることが起きているだけですので、それをもって「FXではセットアップは役に立たない」ことにはなりません。
実際には、次の「トレードする時間足でのセットアップ」によって、そうした値動きの中では様子見となるケースも多いものなので、このことも踏まえて、セットアップの優劣は「トータルで見てどうか?」で判断するようにして下さい。
トレードする時間足でのセットアップの作り方
日足のセットアップで「トレードしてはいけない条件」を定め、4時間足のセットアップで「トレード戦略」を定めた次は、実際にトレードする時間足でのセットアップを定めていきます。
ちなみに、中くらいの時間足のセットアップがしっかり練られていれば、トレードする時間足ではトリガールールに従うだけでも問題ありません。
この記事の冒頭でも説明したように、「エントリーするタイミングを定めた条件」のことです。
トリガーの条件が成立したらエントリーしてポジションを持ちます。
しかし、今回のセットアップ例ではルール内容が不十分なので、さらにトレードする時間足でもセットアップを定めることにします。
セットアップの具体例
今回はトレードする時間足として15分足を採用し、次のような優位性を積み重ねていきます。
15分足「買い」のセットアップ(例)
- (必須A)15分足の上昇トレンドからの保ち合い(フラッグ、ペナント、レクタングルなど)になっている。
- (必須B)もしくは、ダブルボトムのネックラインを上抜け、レートが15分足の20MAよりも上(ブルの位置)にあり、MAが横ばいか上昇している。
「必須A」もしくは「必須B」の内、どちらかの条件が満たされたらセットアップが成立したとみなします。
「必須A」の条件は、上昇トレンド中のレンジ(保ち合い)が継続方向へブレイクしやすい傾向を用いたものです。
「必須B」の条件は、4時間足レベルの調整の値動き(押しの下落)が反転して、4時間足のトレンド方向へと回帰していくところを捉えようとしたもので、「大きなトレンドの継続性」の傾向を用いたものです。
さらに「必須B」では、15分足レベルで逆張りトレードにならないよう、横ばいか上昇するMAの上にレートが位置することを条件として加えています。
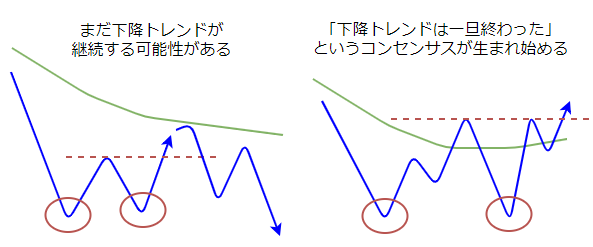
上の図のように、右側のチャート状況の方が、多くの相場参加者にとって反転上昇する可能性(下降トレンドが継続しない可能性)が高く見えるはずですし、そういった“ムード・雰囲気”が「売買の偏り」を生み出す源となる傾向があるため、こうした条件設定は軽視できません。
下のチャートは、そうしたダブルボトムの値動きの具体例です。
※クリックすると拡大します。
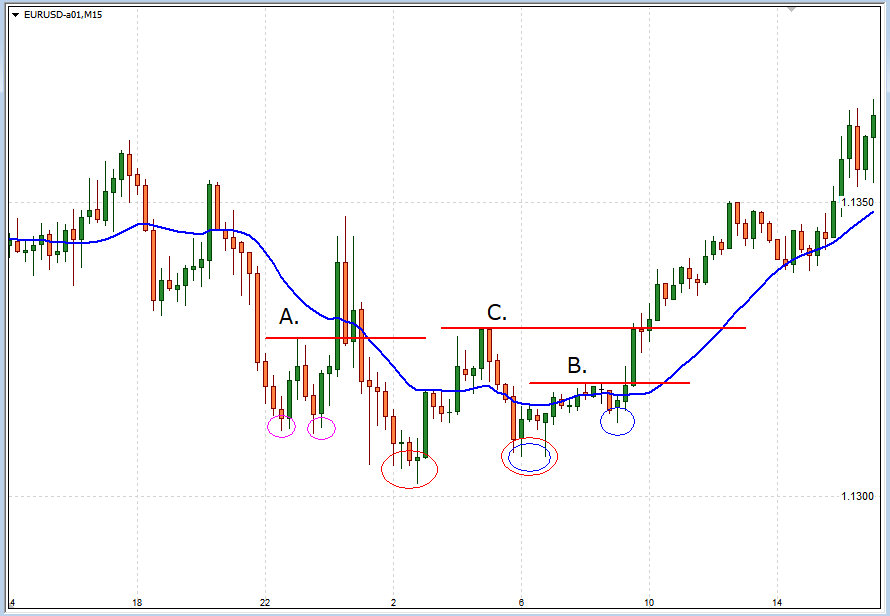
上位時間足に「押し目買いの優位性」があるチャート状況で、15分足で「必須B」のセットアップが整うのを待っている場面です。ピンク、赤、青それぞれの丸印は、それぞれダブルボトムの二つの安値を示しています。
ネックライン「A」を抜けたところでは、レートはベアの位置にあり、20MAもまだ下降~水平になっています。若干の乱高下の後、ダブルボトムの安値を下抜けて下落していきました。
ネックライン「B」もしくは「C」を抜けたところでは、20MAは継続的に横ばいになっていて、そこから上昇をしていきました。
こうした傾向について、あなたも自分の手で過去チャートをチェックしてみて下さい。
実際のチャートで確かめてみる
下のチャートは、上位時間足が継続的に上昇している状況での15分足チャートです。
※クリックすると拡大します。
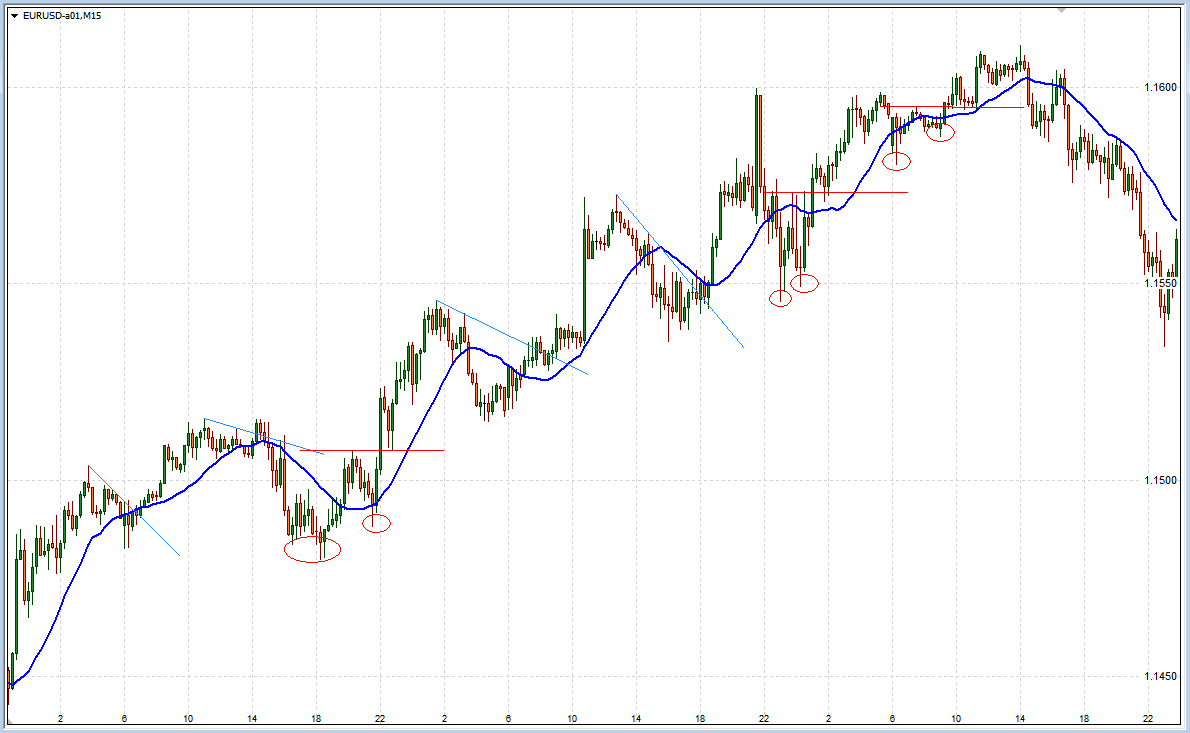
赤いラインはダブルボトムのネックライン、水色のラインはフラッグのラインです。それらのラインをブレイクした(上抜けた)時点でセットアップが成立することになります。
当然、セットアップが成立しても伸びていかないケースも散見されますが、トータルで見れば利益を出しやすくなっていることが分かると思います。
ラインのブレイクを判断するタイミングについて
ちなみに「終値でのブレイク」と「リアルタイムでのブレイク」、どちらのブレイクを選択するかはトレーダーによります。どちらにも一長一短がありますので、一概にどちらが優れているとは言えません。
ブレイクをどう判断するかは、セットアップ成立のタイミングに関わり、それはそのまま「トリガールール」の成立タイミングにも関わってくるため、トレード手法全体のパフォーマンスを考慮しながら決めていく必要があります。
しかし最初の内は、ローソク足の終値確定をブレイクタイミングとして選択するがおすすめです。
そうすることで、過去チャートを使った検証がやりやすくなりますし、トレード練習や実戦でも慌てることが減り、メンタル面でのアドバンテージもあるからです。
セットアップが成立したらトリガーに従ってエントリーする
15分足でもセットアップが成立したら、ポジションを持つためのエントリータイミングを見計らっていくことになります。
今回はセットアップの記事ですのでトリガーの詳細は省きますが、先程の15分足のセットアップが満たされた場合のトリガーについて、概要だけお伝えしておきます。
「必須A」の条件が満たされた場合は、フラッグやペナントのラインがあるはずですので、そのライン抜けのプライスアクションでエントリーすることが考えられます。
そこにフィルタールールとして「MACDが上昇していること」などを加えるアイデアもありますが、基本的にフィルタールールを増やせば増やすほど、実際のトレード回数は減少していきますので注意が必要です。
また今回解説してるセットアップでは、上位時間足のルールが保守的に設定されていることから、15分足ではライン抜けを待たずに、別のテクニカル指標のサインでエントリーすることも妥当といえます(ブレイク見込みのエントリー)。
「必須B」の条件が満たされた場合は、15分足のセットアップが成立したタイミングでエントリーしてしまう方法も無理ではありませんが、損切りの位置を深めにする必要があったりしますので、やはり、何らかのプライスアクションを利用したトリガーを用いるのが保守的といえるでしょう。
ともあれ、しっかりと過去チャートを使って検証し、トレード練習ソフトやデモトレードで優位性を確認するプロセスが大切なのを忘れないで下さい。
トリガーについては、下の記事で詳しく解説していますので、併せて参考にして下さい。
FXのセットアップに魔法はいらない
ここまで、具体的なセットアップを挙げながら、その作り方と注意点について解説してきました。
ご覧になってお分かりのように、それぞれのセットアップ要素は、余程のFX初心者でない限り、誰もが一度は目にしたことのある「普通のテクニカル分析」に過ぎません。
FXで利益を生み出すためには、秘密のテクニカル指標や突飛な分析手法は必要なく、今回のような「相場心理に則ったシンプルな優位性」を組み合わせていくことでも可能なのです。
また、このようなセットアップによる“お膳立て”をすることで、エントリー前の時点で一定以上の優位性を確保することが出来ます。
そのため、そこから実際にポジションを持つ際にも、「エントリーと決済で余程のヘマをしない限りは、トータルで大きく負けるようなことは無い」という精神的な安定を感じながら、トレードしていけるようになります。
もちろんそのためには、あなたの手で検証とトレード練習をする必要がありますが、信頼のおけるセットアップが組み込まれたトレード手法を手にしてFXで勝つためにも、少しずつでも実践してみて下さい。
セットアップの意味と作り方~まとめ
セットアップとは、FXのトレード手法を構成する要素のひとつで、FXトレードをするのに相応しい状況を特定するための“条件”を定めたもののことです。
相場の環境認識をして背景分析をおこない、トレード戦略を立てる──こうしたFXでの一連のトレード判断をルール化したものといえます。
セットアップは、チャートを分析してトレード戦略(シナリオ)を立てていく大切なルールですから、事前に十分な検証をしておくことが必要になります。
トレード中にセットアップを無視したり、そもそもセットアップに優位性がなかったりすると、そこでいくらエントリーしてもトータルでは利益につながりません。
セットアップはむやみに複雑にしたり、過剰に精密にしたりせず、出来るだけ再現性が高くなる(繰り返しやすくする)ように設定しておくのが好ましいです。
セットアップを作る際におすすめなのは、レートの動き(値動き)そのものを対象にすることと、多くのトレーダーが注目するテクニカル指標を参考(補助)にすること、そして相場参加者の集団心理を考慮することです。
以上、『セットアップ』とは?その意味とFXトレード手法の重要部品の作り方──についてお伝えしました。
こちらの記事もおすすめです