あなたは「フラクタル構造」とは何か、ご存知ですか?
フラクタル構造を知ることで、FXのチャートを複数の時間足にわたって分析する「マルチタイムフレーム分析」のことが、これまでよりもずっと理解できるようになります。
今回は、マルチタイムフレーム分析の肝(きも)ともいうべき「フラクタル構造」について、わかりやすく解説しています。
「フラクタル構造」とは何か?
フラクタル構造とは、簡単にいうと「どんなに小さな一部分をとっても、それが全体と同じ形をあらわしている構造」のことで、自己相似と呼ばれるものです。
具体的な例をあげると、「雪の結晶」や「海岸線」「ブロッコリー」といったものが有名です。


雪の結晶の先端を拡大してみると、そこには、結晶全体と同じ形をした小さな結晶が集まっていているのが分かります。
また、岩手県の三陸海岸をはじめとする「リアス式海岸」は、衛星写真の映像も、高台から眺めた景色も、どちらも同じように入り組んだ形の海岸線に見えます。
これらは、そのなかの一部分を拡大(ズームイン)していっても、そこにまた「全体と同じ構造があらわれる」という特徴があります。
これを「フラクタル構造」といいます。
下の図で説明すると、このフラクタル構造の三角形は、どの一部分を拡大(ズームイン)していっても、そこに「全体と同じ構造」があらわれます。
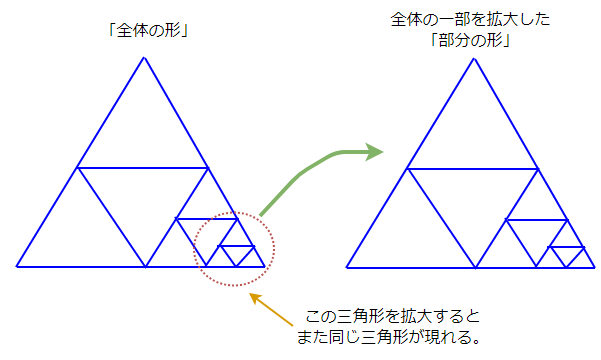
理屈の上では、「一部分を拡大して、さらにその一部分を拡大して……」と、無限にくり返すことができ、そこには延々と「全体と同じ構造」があらわれることになります。
FXのチャートもフラクタル構造である
実はFXのチャートも、この「フラクタル構造」をもっているのです。
そして、このことが理解できると、複雑に思えた「複数時間足をつかったマルチタイムフレーム分析」が、明確なイメージを伴って分かるようになります。
まず、日足チャートを眺めてみる
まずは、ごく普通の日足チャートを眺めてみましょう。
※クリックすると拡大します。
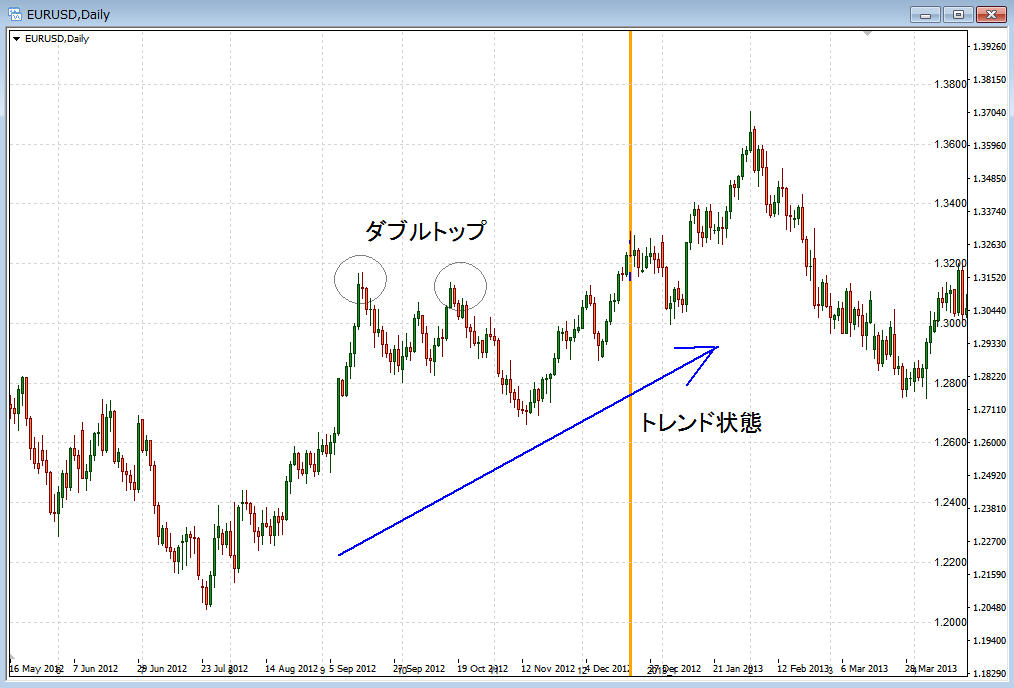
テクニカル指標がまったくない、シンプルなローソク足だけのチャートなので、トレンドの状態や、ダブルトップなどのチャートパターンがよく見えると思います。
ダブルトップについて詳しくは、下の記事で解説していますので参考にして下さい。

さて、そもそも「日足チャート」というのは、一日の値動きを1本のローソク足であらわしたチャートです。
つまり、1本のローソク足には、一日の間におこなわれた相場参加者たちのトレードが、ギッシリ詰まっているわけです。
ということは、その1本のローソク足を拡大すると(ズームインすると)、一日の間に行われたトレードの様子が、詳しく見えてくるということです。
「一本のローソク足を拡大する」とは?
ところで「一本のローソク足を拡大する(ズームインする)」とは、どういうことでしょうか?
それは「一本のローソク足を細かく分けること」と言い換えることができます。
一本のローソク足だけだと、そのローソク足が始まったレートと終わったレート(始値と終値)、そして最高値と最安値の情報しか分かりません。
一本だけだと、その中で具体的にどういう風にレートが上下して動いていたのかは、分かりません。
ですから、ローソク足ができる時間の間隔を小さくして、たくさんのローソク足を表示させてやればいいわけです。
つまり「チャートの時間軸を小さくすること」=「その一部分を拡大すること」といえます。
日足の一部分を拡大してみると、同じ形(フラクタル構造)が現れた
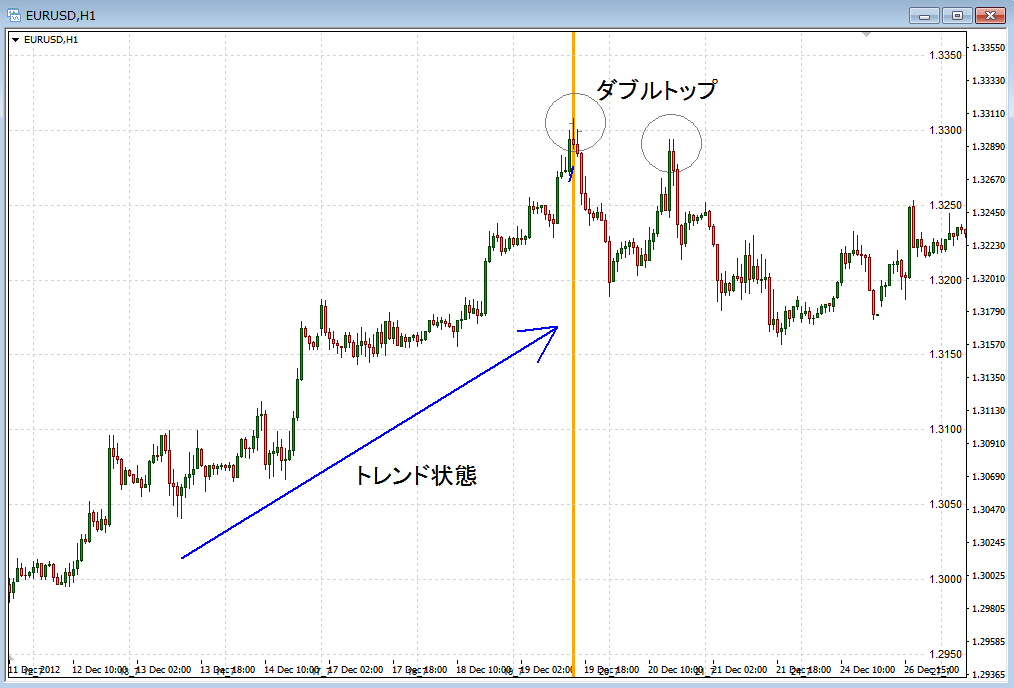
ということで、日足チャートの一部分をズームインして「1時間足チャート」で表示させてみました。
日足と1時間足の「オレンジのライン」は、どちらも同じ日時を示しています。
1時間足のローソク足が24本できると、日足1本分になりますから、1時間足チャートは「日足を24倍に拡大したチャート」といえます。
どうでしょうか?
日足チャートを拡大した1時間足にも、日足と同じように、トレンド状態やダブルトップなどのチャートパターンが見て取れますね。
「一部分を拡大すると、そこに全体と同じ構造があらわれている」──まさに、フラクタル構造になっているわけです。
さらに、一部分を拡大してみると、また同じ形(フラクタル構造)が現れた
先ほどの1時間足の一部分を、さらに拡大(ズームイン)してみましょう。
同じ場所のローソク足を、今度は「5分足チャート」にして表示してみます。

5分足のローソク足が12本できると、1時間足1本分になります。
ですから、5分足チャートは「1時間足を12倍に拡大したチャート」といえますし、さらには「日足を288倍に拡大したチャート」でもあります(24倍×12倍=288倍)。
どうですか?
ここでもやはり同じように、トレンドの状態やダブルトップなどのパターンがあらわれ、フラクタル構造になっていることが分かります。
5分足に拡大しても、そこには全体と同じ構造があらわれているのが分かりますね。
これを図にすると、下のようになります。
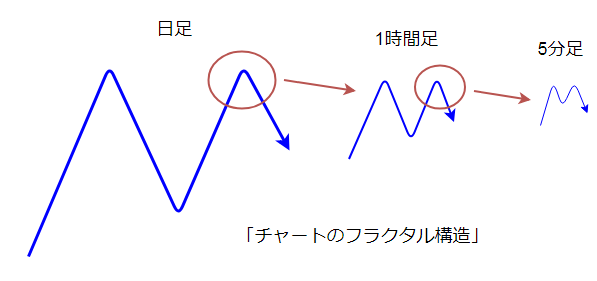
ダブルトップの一部分を拡大すると、そこには同じようにダブルトップが現れ、さらに拡大するとまたダブルトップが現れます。
ちなみに、こうして見ると、どの時間軸のチャートも同じような印象があって、そのため、1時間足チャートを「日足です」といわれても、すぐには気づかないのではないでしょうか?
──ここまで見てきたように、こうした事実を通じてFXのチャートがフラクタル構造であることが理解できます。
マルチタイムフレーム分析は、フラクタル構造を利用している
大きな時間足のFXチャートの一部分を拡大していくと(時間足を小さくしていくと)、そこには同じような値動きやチャートパターンがあらわれてきます(=フラクタル構造)。
つまり、それぞれの時間軸のチャートは、そのスケール(拡大率)が違うだけで、値動き自体は同じようなものなのです。
違いは、その値動きができた「時間の長さ」です。
日足チャートでダブルトップができるには、数週間から数ヶ月掛かりますが、5分足だと数時間ほどでパターンがあらわれます。
この、「どの時間足でも値動きのパターンは同様である(=フラクタル構造である)」という特徴をつかうと、大きな時間足の変化を小さな時間足で早めにとらえることができたり、小さな時間足のトレンドが終わりそうな状況を想定したり出来るようになります。
小さな時間足は、大きな時間足の一部だということ
FXのチャートは「フラクタル構造」だということ──つまり、「小さな時間足は、大きな時間足の一部分」だということが理解できれば、複数時間軸をつかったマルチタイムフレーム分析は、一気に身近なものになります。
例えば、4時間足のチャートが上昇トレンドだったとしましょう。
その上昇トレンドの先端を、15分足に拡大してみると、そこにはヘッドアンドショルダーが出来ていました。
長期的には、まだまだ上昇トレンドが続くかもしれませんが、短期的には上昇の動きは一服する可能性が高いと判断できます。
ですので、買いのポジションを手仕舞いしてもいいでしょうし、ここから4時間足のチャートポイントまで、積極的に売りのデイトレードやスキャルピングをするという方法もあり得ます。
このようにマルチタイムフレーム分析では、フラクタル構造の特徴を利用して、「大きな流れの中の、現在の小さな動き」を分析したり、「現在の小さな動きが、大きな流れに及ぼす影響」を判断していきます。
マルチタイムフレーム分析については、下の記事で具体的なトレード手法を紹介しながら詳しく解説しています。

エリオット波動理論もフラクタル構造をもっている
FXトレードを学んでいると、必ずといっていいほど出てくるのが「エリオット波動理論」です。
エリオット波動理論とは、米国の株式アナリストのラルフ・ネルソン・エリオット(1871~1948)が考案した、チャート分析理論のことです。
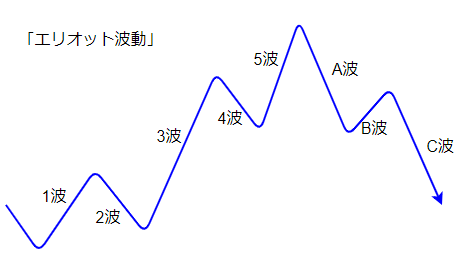
「レートの動きは波動を描く」というのが基本コンセプトとなっており、その波動は「5つの上昇波」と「3つの下降波」に分類され、それらが相場の流れのなかでくり返される──というものです。
エリオット波動もフラクタル構造として捉えることで、マルチタイムフレーム分析と同様に、FXのトレード戦略を立てる上での武器にすることが出来ます。
例えば、大きな時間足でダブルボトムが形成されて、その後ネックラインを抜けて上昇中だった場合、大きな時間足は「エリオット波動の上昇第3波」に入っていると考えられます。
そこでその下の小さな時間足でも、調整の値動きを経て反転上昇したところ、つまり同じ「エリオット波動の第3波」に入ったところでエントリーをした上で、出来るだけホールドし続ける(利食いを先延ばしにする)というトレードが有効になってきます。
これは、エリオット波動の第3波をフラクタル構造の視点で見て、その中の「小さな第3波」でトレードをしているというわけです。
このように、フラクタル構造の考え方を応用していけば、FXで優位性のある値動きを捉えやすくなります。
『フラクタル構造』とは?~複数時間足チャートのまとめ
フラクタル構造とは「一部分が全体をあらわしている構造」のことです。
フラクタル構造をもつものは、その中の一部分を拡大(ズームイン)していっても、そこにまた「全体と同じ構造があらわれる」という特徴をもっています。
FXのチャートもフラクタル構造をもっているので、小さな時間足は大きな時間足の一部分として、同じような値動きを見せます。
そして、複数時間軸をつかったマルチタイムフレーム分析とは、このフラクタル構造の特徴を利用して、「大きな流れの中の、現在の小さな動き」を分析したり、「現在の小さな動きが、大きな流れに及ぼす影響」を判断していくものです。
以上、『フラクタル構造』とは?FXで複数時間足チャートを使いこなす方法について、お伝えしました。
こちらの記事もおすすめです