
Multi-time frame analysis is a technical analysis method that comprehensively analyzes multiple time frame charts to make entry and settlement decisions.
In this article, we will explain in detail how to use multi-time frame analysis to “discover advantageous price movements early”.
*For the basic usage of multi-time frame analysis and FX methods, please refer to the explanatory article below.
Explanation What is Multi Timeframe Analysis? Methods and Tips, Forex Methodology
- How to use multi-timeframe analysis as an “early price movement detector
- The method of capturing “price movements in the middle” before the candlestick is fixed
- Practical examples of multi-timeframe analysis for early detection of price movements
- The Fractal Structure of FX Price Movements
- Disadvantages of the “Early Detector of Price Movements” with multi-timeframe analysis
- How to use multi-timeframe analysis to detect advantageous price movements early – Summary
How to use multi-timeframe analysis as an “early price movement detector
With multi-time frame analysis, you can observe and analyze the entire market situation from a bird’s eye view, and thus accurately determine whether the current situation is one in which selling or buying has the advantage.
This is a major merit of multi-time frame analysis, but there is another useful usage.
That is how to use multi-time frame analysis as an “early price movement detector.
The method of capturing “price movements in the middle” before the candlestick is fixed
In multi-time frame analysis, each large and small hourly chart has a zoom-in and zoom-out (expansion and contraction) relationship with each other.
On an hourly chart, a single candlestick is not completed (fixed) until one hour has passed.
However, during that one-hour period, 12 candlesticks on the 5-minute chart and as many as 60 candlesticks on the 1-minute chart can be finalized.
And on a 5-minute or 1-minute chart, some kind of price action or chart pattern may be forming.
In other words, switching from one time chart to a smaller time chart (zooming in) allows us to get an early read on more detailed price movements.
For example, by observing price movements occurring within the current one hourly candle before it is fixed on a “lower (shorter) time frame chart,” it is possible to make an entry with an advantage at an earlier time.
This is the “Early Detector of Price Movements” technique based on multi-timeframe analysis.
Practical examples of multi-timeframe analysis for early detection of price movements
Now let’s look at a practical example with a concrete chart.
The chart below is a 30-minute chart that assumes day trading for a wide price range.
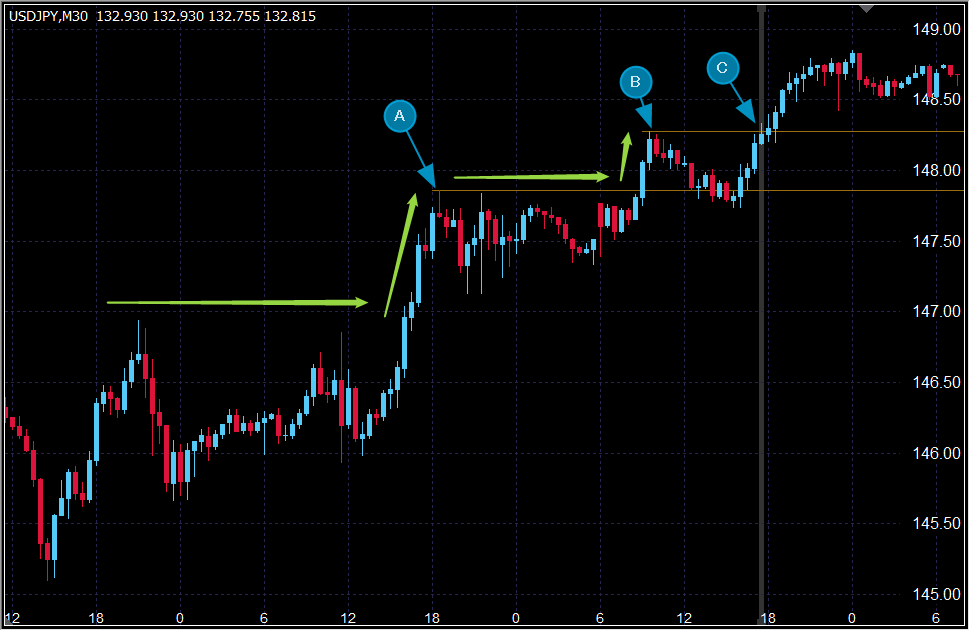
After the high “A” was set, the price was in a range (ascending triangle) for a while, then broke out to the upside, set a new high “B,” and then formed a push price movement (gradual decline).
Since the uptrend is seen to be continuing in the market situation, it is considered to be an advantageous trade to take a straightforward buy position.
And in this case, the point “C” (above the high “B”) is the entry point for a simple break above the high on this 30-minute chart.
What I want you to consider here is that if the stair-step uptrend is continuing and there are no patterns such as double tops or spikes that suggest a reversal to the downside, then there is a high probability that the gradual decline from the high “B” is a “push adjustment“.
In other words, probabilistically, there is a “possibility of reversal and resumption of upward movement” at an early stage.
If this is the case, we should be able to hold an advantageous buy position if we can catch the price movement of a reversal and resumption of the upward movement at an early stage.
Therefore, let’s use the 5-minute chart, which is a chart lower (zoomed in) than the 30-minute chart, as an “early detector” to capture the price movement of a reversal and rise that cannot be seen on the 30-minute chart.
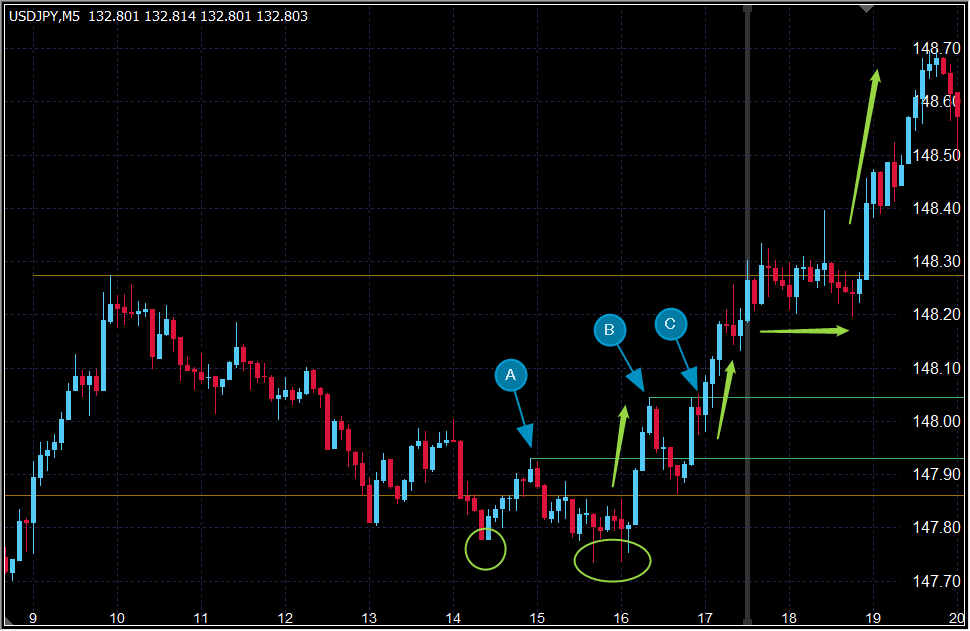
This 5-minute chart shows the price action immediately following the break above the ascending triangle on the 30-minute chart.
The rate, which has been gradually reduced by the push price action, has formed a double bottom (two green circles)
Then, a series of long white candlesticks quickly broke through the neckline high “A,” and the price reached the high “B.” At this point, the “Reversal Rising Pattern” (double bottom) was formed (two green circles).
At this point, a “reversal uptrend pattern (double bottom)” was formed, and if the high “B” is broken, a clear uptrend will be established on the 5-minute Dow Theory level.
Therefore, the break point “C” can be a reasonable buy entry timing with an advantage when the horizontal line is used as the analysis standard.
The price movement leading to this entry point cannot be confirmed on the 30-minute chart.
This is the advantage of using the lower time chart as an early detector.
The above is a concrete example of multi-timeframe analysis using the lower timeframe chart as an “early price movement detector.
The Fractal Structure of FX Price Movements
Behind the ability to use multi-time frame analysis in this way is the “fractal structure” of exchange rate price movements.
A fractal structure is simply “a structure in which a small part of an object has the same shape as the whole object,” and is called self-similarity.
The most well-known examples are snowflakes and broccoli.


For example, if you zoom in on the tip of a snowflake, you will see that there is a cluster of smaller crystals that have the same shape as the entire crystal.
This kind of fractal structure is a characteristic structure that can be seen in the price movements of multi-hour charts as well.
For example, when a double top chart pattern is formed on the daily chart, we can also see double tops forming on the hourly and 5-minute levels within it.
Please see the following article for more details, as understanding fractal structure will give you a better understanding of multi-timeframe analysis.
Explanation What is Fractal Structure. how to use multiple time charts in Forex successfully?
Disadvantages of the “Early Detector of Price Movements” with multi-timeframe analysis
Now, the “early price movement detector” by multi-time frame analysis has not only advantages but also disadvantages.
Using a zoomed-in “lower time frame chart” makes it easier to see “immediate minor price movements” that you would not normally see.
Therefore, if you do not have a scenario firmly set up according to your trading method, you are likely to be at the mercy of the price movements and make a lot of unnecessary entries.
For example, a typical case is when you are in an uptrend on a large time frame, and you are supposedly aiming to buy at the push point, but when you see a head-and-shoulders formation on a smaller time frame, you rush to make a sell entry.
In addition, since you are entering a market at a stage when it has not yet been decided whether to buy or sell (i.e., the advantage is not yet clear) on the chart of the time axis for entry, even if the market is following the trend direction of the upper time axis, there is a good chance that it will easily reverse and you will end up losing your money.
Therefore, it is important to clarify the “rules for setting stop-loss lines” and “rules for re-entry” when using the early detector method.
Ideas for countermeasures include limiting the number of early entries using the “early price movement detector,” or limiting the number of early entries to only one and executing the entry on the original execution chart as well.
These countermeasures should be clarified in advance by verifying past charts and practicing trades.
How to use multi-timeframe analysis to detect advantageous price movements early – Summary
In multi-time frame analysis, large and small time frame charts have a zoom-in and zoom-out (expansion and contraction) relationship with each other.
Therefore, by switching from one time frame chart to a smaller time frame (zooming in), it is possible to read more detailed price movements and chart patterns, and to identify advantageous price movements at an early stage.
The above is how to use multi-timeframe analysis to detect advantageous price movements at an early stage.
こちらの記事もおすすめです