
FX取引におけるオーバーシュートとは、為替レートが急激に変動した結果、行き過ぎた値動きを見せることです。
「行き過ぎた値動き」とは、市場参加者の間で「この水準程度まで上昇(下落)するだろう」と見込まれていた一定のレートを、想定外に大きく抜けてしまった状況を指します。
多くの場合、オーバーシュートが起きると反対方向への「調整の値動き」が発生し、乱高下を経ながら、一旦は売り手と買い手の均衡点(需給バランスの均衡点)へとレートが収まっていく傾向が見られます。
この記事では、FXで起きるオーバーシュートについて、具体例を取り上げながら詳しく解説し、オーバーシュートの値動きを利用したトレード手法のアイデアも紹介していきます。
FXでのオーバーシュートのチャート例
FXにおけるオーバーシュートの例としては、多くの相場参加者から注目される高値や安値をブレイクアウトした際、値動きに抵抗する勢力による押しや戻しが無いまま、いくつものチャートポイントを一気に突き抜けていく──というケースがあります。
また、要人発言や事件、災害といった突発的なニュースによって市場が過剰反応を示した際に、「然るべき反発や抵抗が現れるであろうチャートポイント」を一気にいくつもブレイクアウトしてく形でオーバーシュートが起きるケースもあります。
それでは、こうしたオーバーシュートについて、実際のチャートを見ていきましょう。
ブレイクアウト後、一気にチャートポイントを抜けていくオーバーシュート
下のユーロドルの5分足チャートは、レンジを下へブレイクアウトした値動きがオーバーシュートしたケースです。
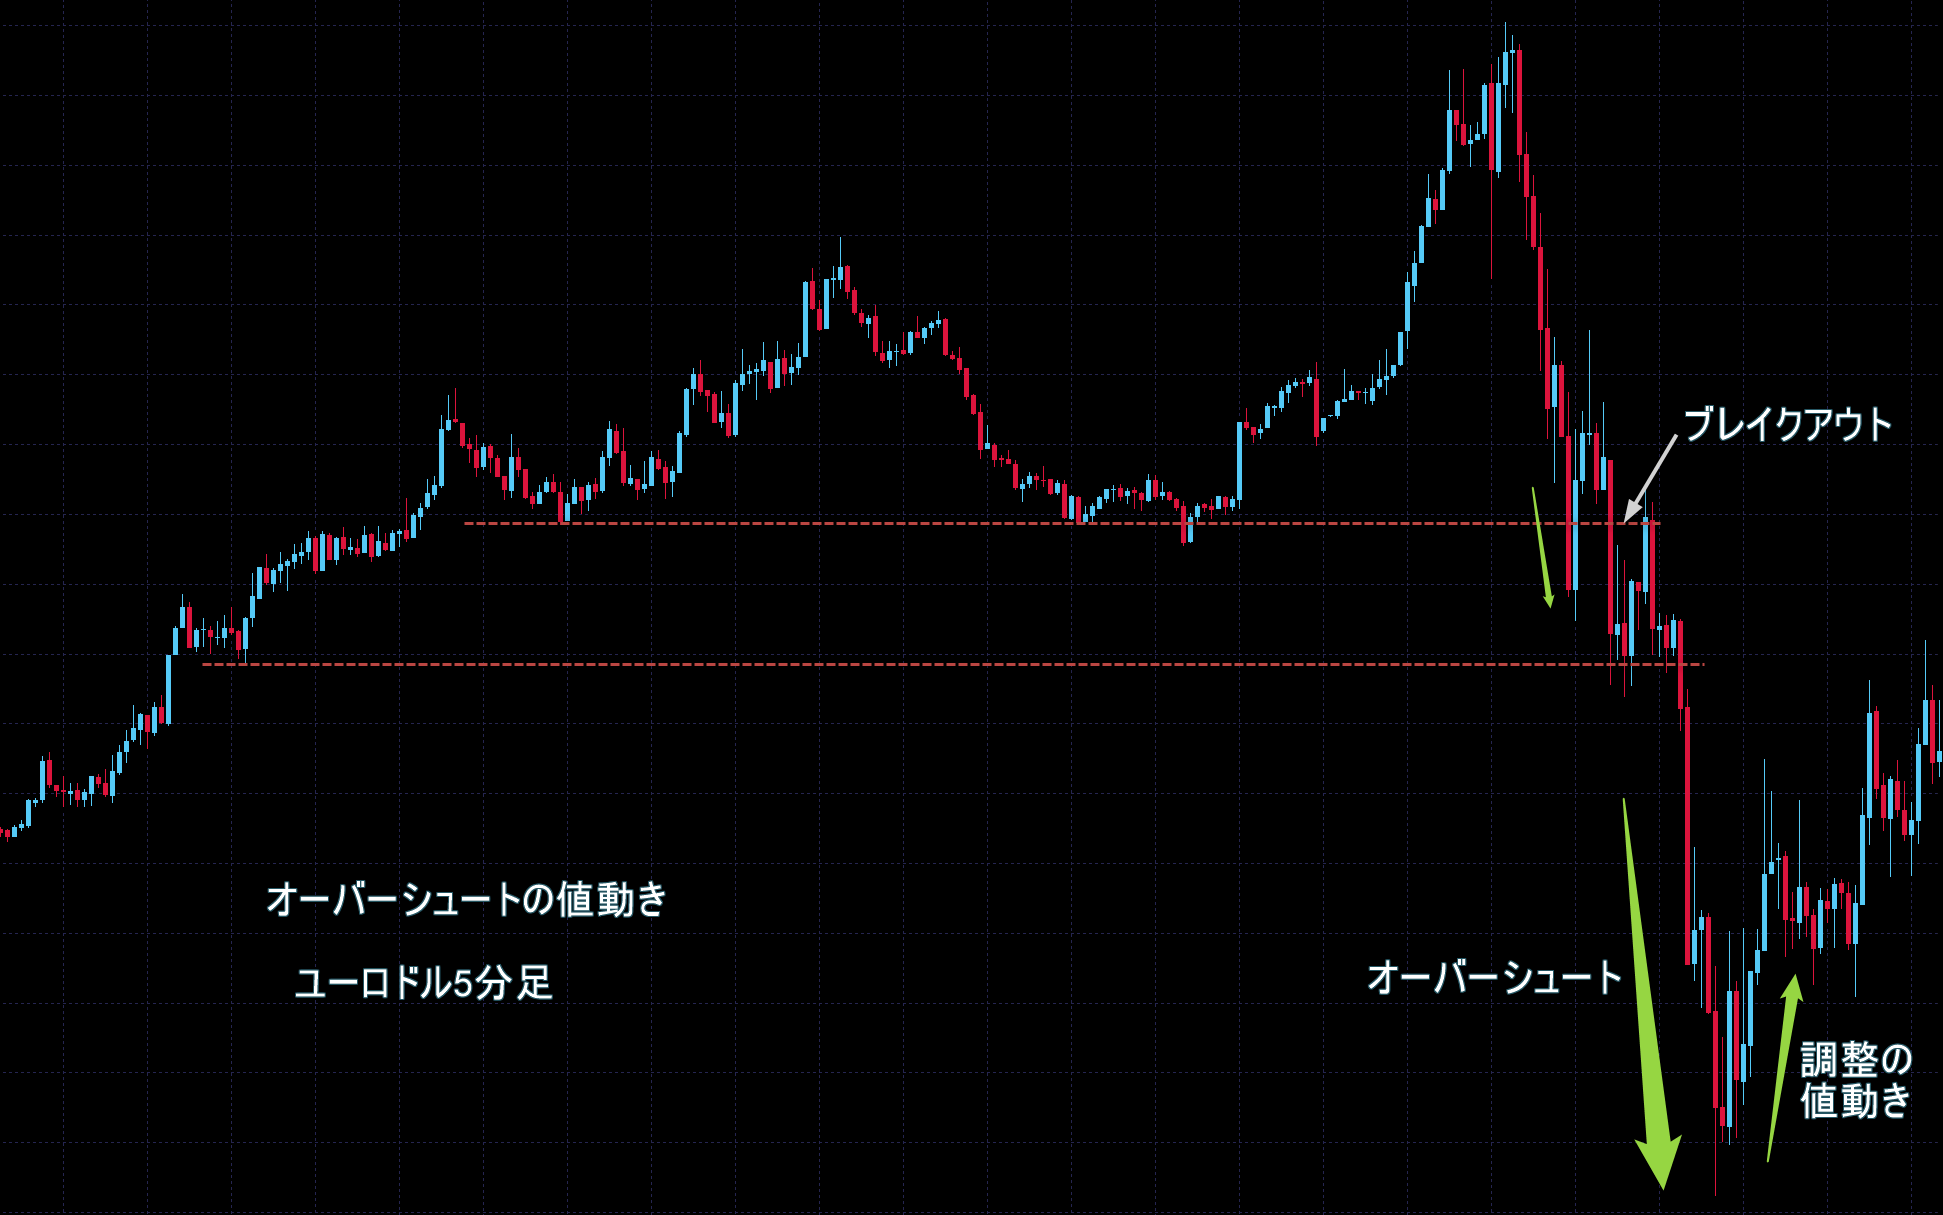
まず一旦、上へ振りかぶるように(全戻しになって)下落方向へブレイクアウトし、しばらく停滞して小さなレンジを形成しましたが、その下限も下抜け、その後は一気に下落してオーバーシュートとなりました。
オーバーシュート後は、短時間の内に調整の値動きが始まり、乱高下を伴いながら反転方向へと強く戻っていきました。
下のチャートは、同じ場面を1時間足にしたものです。
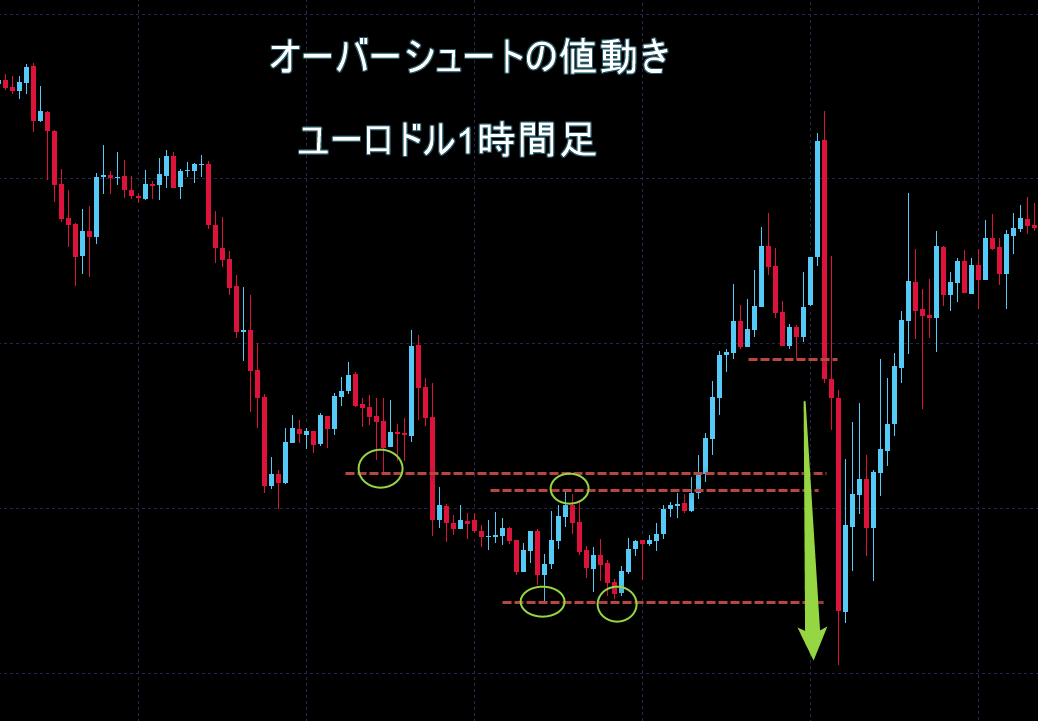
ご覧の様に、以前のダブルトップやダブルボトムを形成する高安値やネックラインといったチャートポイントを、一気に下抜けているのが分かります。
このような、ブレイクアウトによる鋭く急激なオーバーシュートでは、いずれ乱高下を伴う調整の値動きが始まり、相場参加者たちによって新たな方向性が形成されていく傾向があります。
今回のケースで言うと、それまでの1時間足以上で下降トレンドだったものが急激に上昇へ転じようとしたため(短期時間足レベルでは上昇トレンドになっていた)、買い方の早期の利益確定売りと売り勢力による反撃が重なり、下落のオーバーシュートが発生した可能性が考えられます。
そしてその後、乱高下を経て徐々に上昇へと転じ、新たな方向性(トレンド転換)が形成されていきました。
要人発言が原因となったオーバーシュート
下のユーロドルの15分足チャートは、米連邦準備理事会(FRB)パウエル議長の発言が発端となったオーバーシュートの例です。
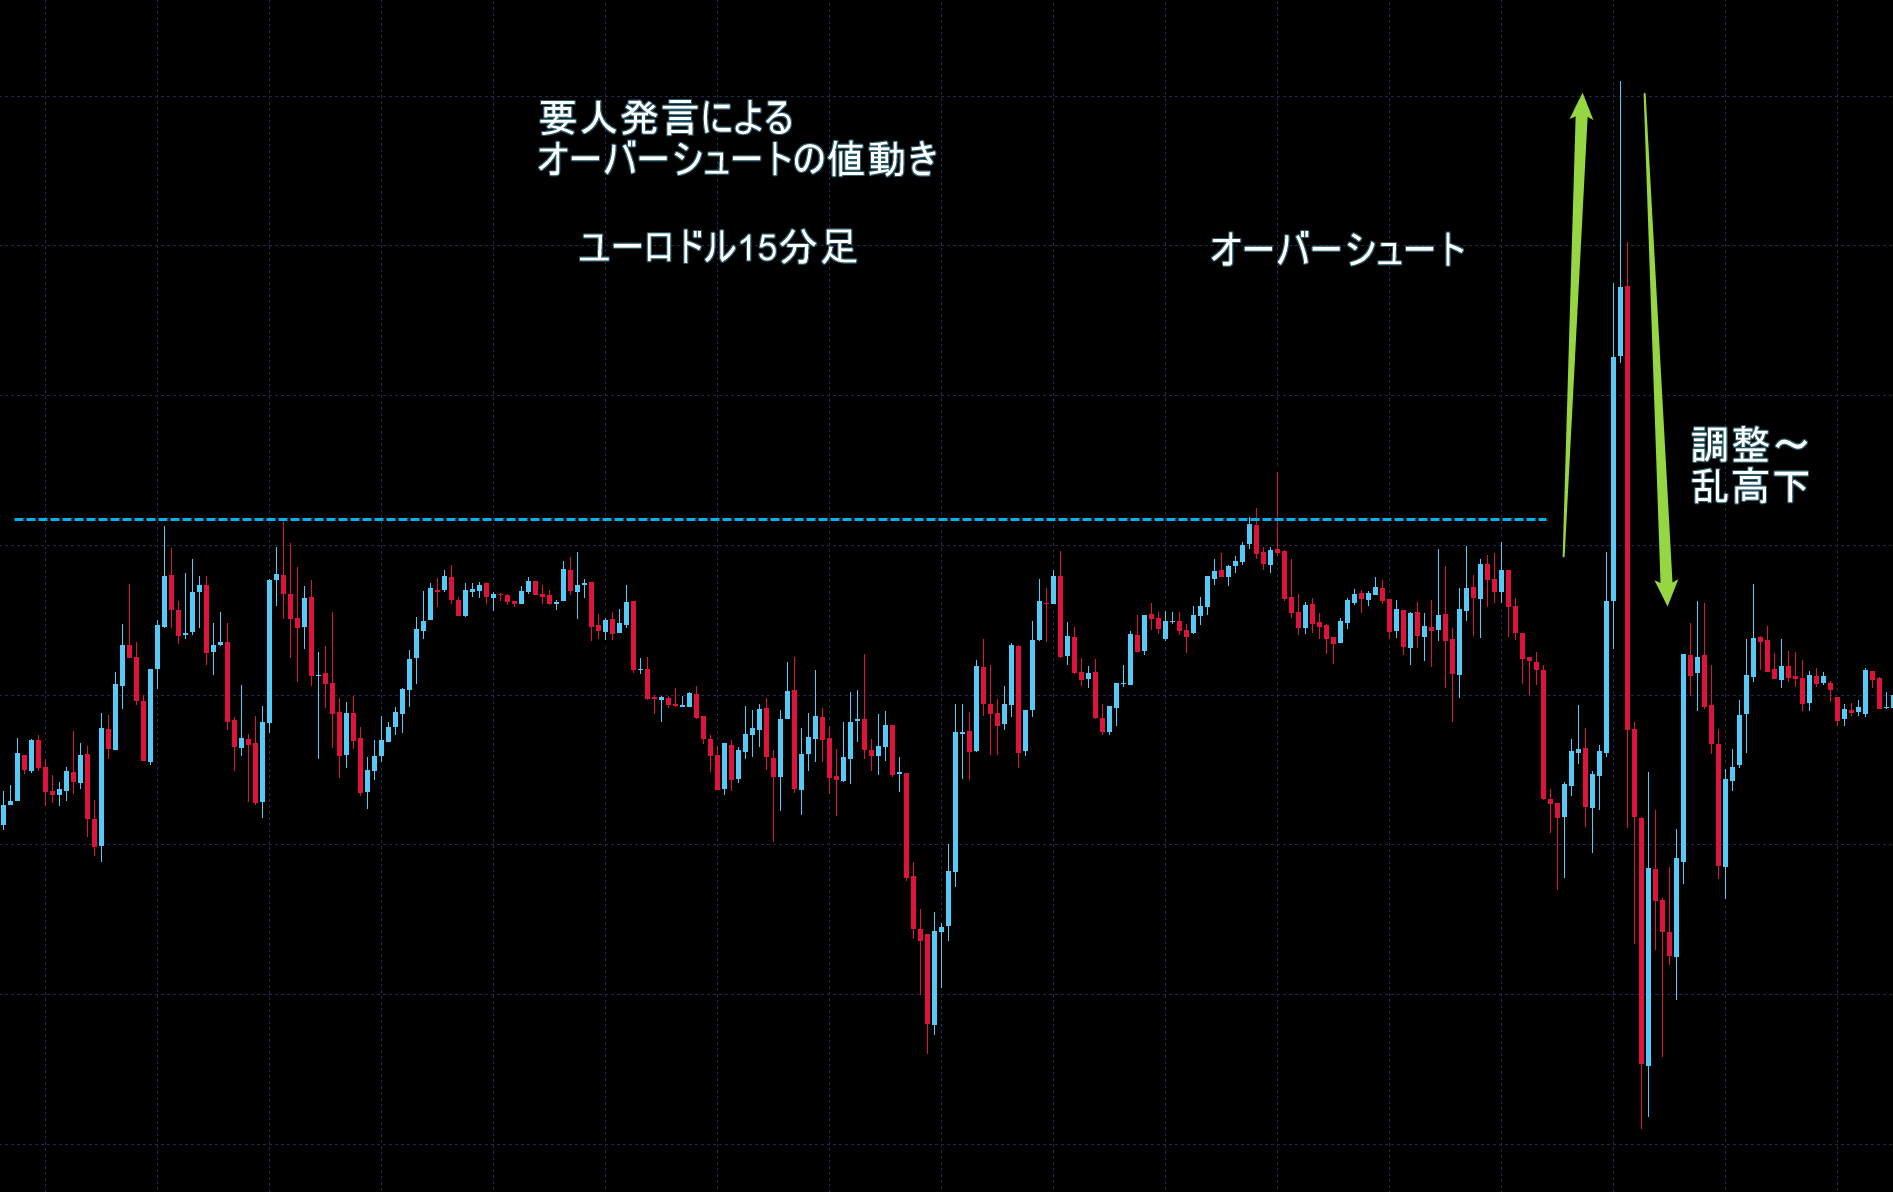
パウエル議長の発言に過敏に反応した市場は、それまでのレンジ上限と1時間足レベルの前回高値を一気に上抜ける「行き過ぎた値動き」すなわち「オーバーシュート」を生み出しました。
しかし直後には、利益確定の反対売買や逆張り勢の参入と思われる急激な下落(調整の値動き)が起き、あっという間に元のレンジに戻ってきました(この一連の値動きの背景には、議長の玉虫色の発言が影響していた可能性もあります)。
これは、レンジブレイクが絡んだオーバーシュートではよく見られる、極端な反転の値動きのひとつと言えます。
結果的には、下のユーロドル1時間足チャートのように、レンジ上限側の長い上ヒゲと下限側の下ヒゲを出した後、新たに上昇トレンドを形成していきました。
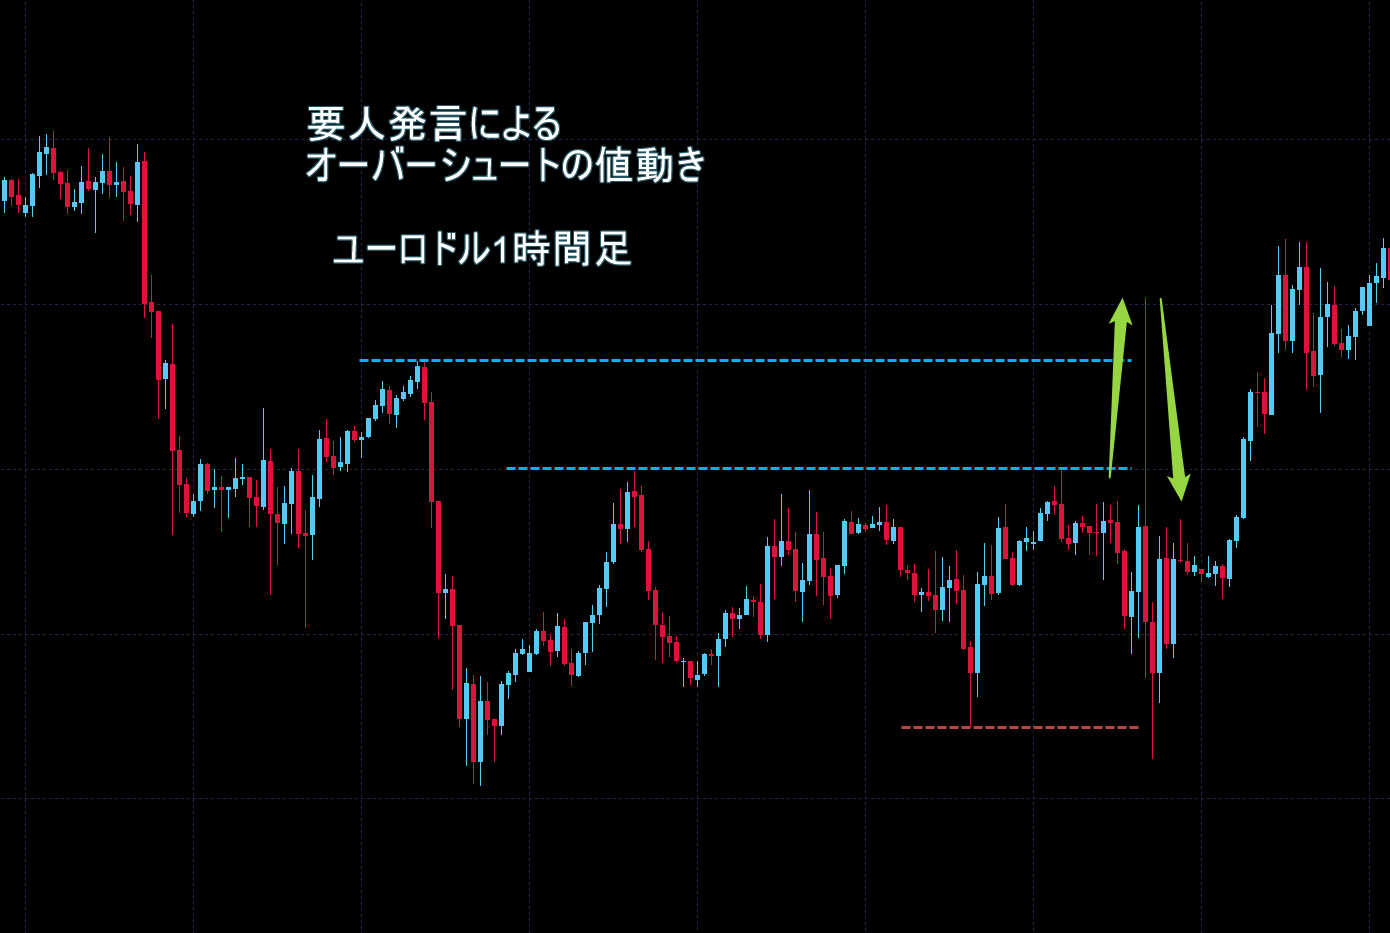
要人発言が原因となるオーバーシュートは、発言内容によってその後の動きは二転三転することも多く、一概に特徴をいい表せません。
しかし、ファンダメンタルズ要因となるような決定的な発言が含まれていた場合は、オーバーシュートからそのまま新たなトレンドが形成される可能性があるため、安易な逆張りトレードは禁物です。
オーバーシュートでのトレードについて(手法のアイデア)
オーバーシュートは「突発的で急激な強い値動き」が特徴であり、多くのケースではオーバーシュートが起きると、一旦は反対方向への「調整の値動き」が発生する傾向があります。
調整の値動き自体が「乱高下」となって、売り手と買い手の均衡点(需給バランスの均衡点)へとレートが収まっていくケースも多く見られます。
オーバーシュートの背景となった要因(決定的なファンダメンタルズの変化)によっては、オーバーシュートを起点にして新たなトレンドへと移行していく場合もあります。
これらオーバーシュートの値動きでトレードをするのはリスクが高く、安易に勢いに乗っていこうとエントリーするのは無謀な行為であるため、基本的にはおすすめ出来ません。
とはいえオーバーシュートによってボラティリティが高まった相場状況は、利益を生み出すチャンスであることも事実です。
ですので、事前の過去チャート検証によって「狙おうとするポイント」の優位性をしっかりと確かめることが大切です。
オーバーシュートにおけるトレード手法のアイデア
オーバーシュートの局面でトレードする方法には様々なパターンが考えられますが、リスクを限定できる方法としては主に次の二つが考えられます。
- オーバーシュート後の停滞(レンジ)の値動きを利用する順張りトレード。
- オーバーシュート直後の乱高下での「波の変化」を捉える順張りトレード。
どちらも基本的には、オーバーシュート後の値動きの中で、改めてオーバーシュート方向へレートが動き始めたのを確認してポジションを持つという形になります。
他にも、オーバーシュートがダマシになったパターンや、オーバーシュート直後の乱高下で逆張りするパターンなどがありますが、それらは難易度が高くなります。
過去チャート検証とトレードの経験を積んでいけば、これらの高難度トレードも選択肢に入ってきますが、慎重に手法に組み入れる必要があります。
1. オーバーシュート後の停滞(レンジ)の値動きを利用するトレード手法のアイデア
FXにおけるオーバーシュートは多くの場合、突発的かつ急激な値動きとして現れます。
そのためオーバーシュート後の反応(調整や乱高下の値動き)も、比較的短時間で形成される傾向があります。
このような値動きの中でトレードをする際には、使用するチャートの時間軸は必然的に小さなものになります。
そこで今回の例では「1分足チャート」を用いて説明を進めていきます。
一般的には「ノイズ的な値動き」だとして考慮から外される傾向のある「1分足チャート」ですが、状況と見方によっては優位性のある値動きを把握することが可能です。
下のチャートはユーロドルの1分足で、指標発表によってオーバーシュートが起こった様子を表しています。

オーバーシュート発生後、何度か高値を切り上げましたが、一度大きく下落しました。
下落幅は徐々に狭まり、ヘッドアンドショルダー(ボトム)が形成されました。
これを下げ止まりのサインと見て、ネックラインを上抜けたタイミング「A」で買いエントリーをするのが優位性のあるポイントです。
その後、さらに安値を切り上げながら、小さな上昇トライアングルを形成し、「トライアングルの高値」と1分足レベルの「過去の戻り高値」を抜けたタイミング「B」が、次の妥当な買いエントリーポイントになります。
このように「下げ止まりを示すチャートパターン」が成立したタイミングで、買い勢力の圧力を背景にオーバーシュート方向へポジションを持つことは、ひとつの優位性のあるトレードだといえます。
とかく「ノイズ」と言われることの多い1分足ですが、ご覧の様に明確な高値と安値の推移が見て取れますし、意味のあるチャートパターンも認識可能です。
興味のあれば、特定の1分足チャートを検証してみることをおすすめします。
2. オーバーシュート直後の乱高下での「波の変化」を捉えるトレード手法のアイデア
オーバーシュートの特徴的な値動きのひとつとして「乱高下の発生」が挙げられます。
次のユーロドル5分足チャートでは、そんな乱高下の様子を見て取ることが出来ます。
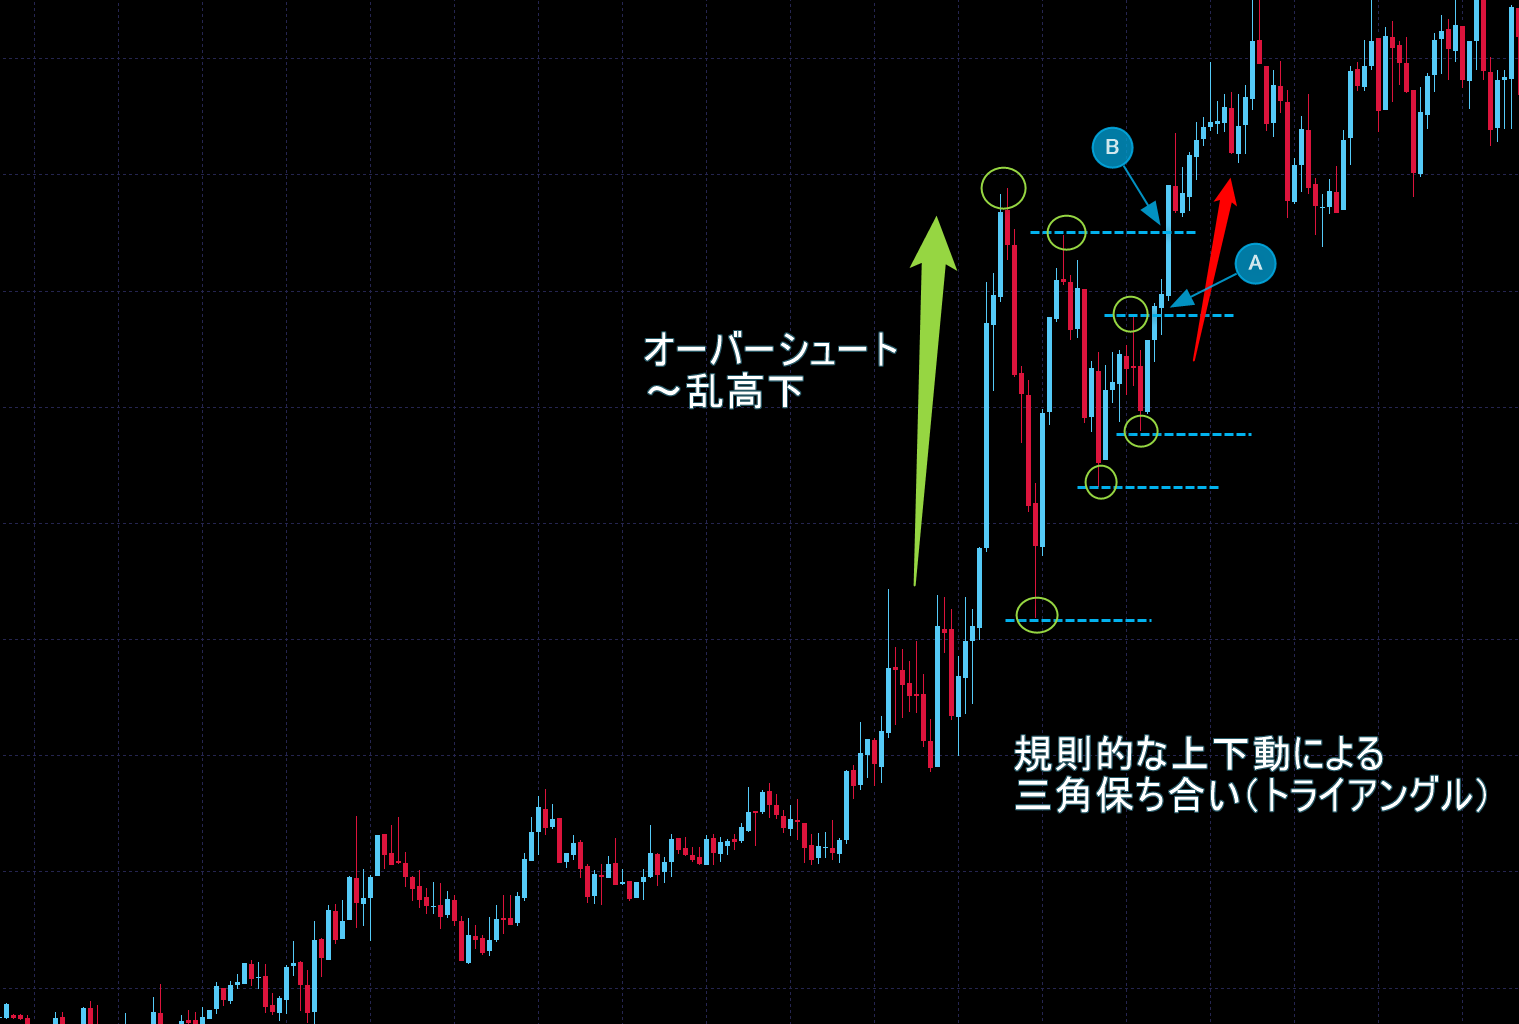
このような乱高下では、ある程度の確率で「規則的な上下動」が生じる傾向が見られ、上記のチャートはその典型的なケースを示しています。
丸で囲った高値と安値を見れば分かるように、どちらも徐々に乱高下の中央へと寄って来ており、短時間の内に三角保ち合い(トライアングル)を形成しつつあります。
ここで注目したいのは、レートの上下動の規則性です。
オーバーシュートの上昇、高値からの反転下落、さらに再上昇──こうした一連の値動きは、どれも「陽線(陰線)の連続」によって規則的に高安値を形成しています。
その後、徐々に反対側の足が混ざりながらも、一定のローソク足の本数で高安値をつけながらトライアングルを形作っていきます。
このように、ここまでは高値と安値の値幅を狭めながら、規則的な上下動を繰り返していたわけです。
しかし「A」の高値抜けをもって、その規則性が破られることになります。
これは「買い勢力と売り勢力のバランス(均衡)が崩れた」という事実を示しており、この瞬間、買い勢力が有利になった──つまり、買いポジションを持つことに優位性がある相場状況になったと判断できます。
買いと売りのバランスが崩れたことを示すもう一つの決定的なポイントは「B」ですが、オーバーシュートによって形成された他の高値の位置によっては、出遅れになったりして優位性が「A」よりも劣る可能性があります。
このように、一見するとランダムに上下しているように見える乱高下ですが、そこにある規則性に注目することで、その規則性が崩れることによる優位性に気づけるようになります。
これは刻々と変化する乱高下を冷静に観察する必要があるため、実戦で用いるのが難しい高度なスキルですが、検証とトレード練習によって身に着ける価値のあるものです。
マルチタイムフレーム分析を活用する
オーバーシュートの値動きでは順張りトレードが妥当だという解説をしてきましたが、注意が必要なのは上位時間足のトレンド方向やチャートポイントの位置関係です。
いくらオーバーシュート後のレンジやチャートパターンからの値動きに乗ろうとしても、そこが上位時間足のチャートポイントに絡む価格帯だった場合、強い反発に巻き込まれる可能性があります。
マルチタイムフレーム分析を踏まえてオーバーシュートを捉えることで、乱高下からのエントリーに柔軟性が生まれたり、オーバーシュート自体がダマシとなったケースでトレードすることも可能になります。
マルチタイムフレーム分析については、下の記事で詳しく解説していますので参考にして下さい。
解説記事 『マルチタイムフレーム分析』とは?やり方とコツ、FX手法を解説
FXでのオーバーシュート~まとめ
FX取引におけるオーバーシュートとは、為替レートが急激に変動した結果、行き過ぎた値動きを見せることです。
オーバーシュートが発生する背景には、レンジブレイクやニュースなどを切っ掛けにしたパニック的な心理や、それを利用しようとする大口の動きがあったりします。
一方的で行き過ぎた値動きは、有意な確率で反転~乱高下に移行する傾向が見られますので、もしリスクを取れるなら、オーバーシュートの値動きを活用するために過去チャート検証をすることは有意義な取り組みだといえます。
以上、『オーバーシュート』の意味とトレード手法のアイデア──についてお伝えしました。
こちらの記事もおすすめです