
初心者がFXの世界で生き残り、そして利益を得ていくためには、テクニカル分析について必ず知っておいて欲しい知識と、身につけて欲しいスキルがあります。
そこで、まず必須の基礎知識のひとつであるトレンドとレンジについて解説していきます。
今回は、あなたがどんなトレードスタイルやトレード手法をつかっていく場合でも必要になる、テクニカル分析の大切な基本についてお伝えしていきます。
チャートを前にして、まず考えること
FXトレードをするとき、あなたがチャートを開いて最初にすることは、目の前の相場が「どういう状況なのか」を把握することです。これがテクニカル分析(チャート分析)の初歩になります。
その状況に応じて──
──こういったことを判断していく必要があります。
FX初心者がいきなりこうしたことを考えることは、難しいに違いありません。
そこで、この状況を判断する最初のステップとして、チャートの状況をシンプルな2種類に分けて考えることを身につけていきましょう。
チャートの状況を見分ける視点「トレンドとレンジ」
初めてFXのチャートを見たときは、無数のローソク足がならぶ様子を目の前にして、ちょっと圧倒されたかもしれません。
このチャートを見て、これから自分なりに「どういう状況なのか」をテクニカル分析によって判断していくわけですが、ここでは難しく考えずにシンプルにとらえることが大切です。
この「シンプルさ」というものは、これからあなたがFXトレーダーとして成長していく上で、とても重要なキーワードになってきますので、「難しい、困った……」と感じたときには、このことを思い出してください。
下の記事では、トレードスキルをシンプルに分解して、ひとつずつ練習していくことの大切さについて解説していますので、こちらも参考にしてください。

値動きに方向感がある状況=「トレンド」
シンプルに考えると、チャートの状況は大きく分けて次の2つに分けられます。
- 値動き(ローソク足の並び方)に方向感が「ある」。
- 値動き(ローソク足の並び方)に方向感が「ない」。
これは、つまり「相場が上か下に動いている」もしくは「どちらともいえない」ということを表しています。
そして、この「値動きに方向感がある状況」のことを「トレンド状態」といい、「どちらともいえない状況」のことを「レンジ状態」といいます。
- 値動きに方向感が「ある」→トレンド状態。
- 値動きに方向感が「ない」→レンジ状態。
トレンド状態をシンプルに図であらわすと、以下のようになります。
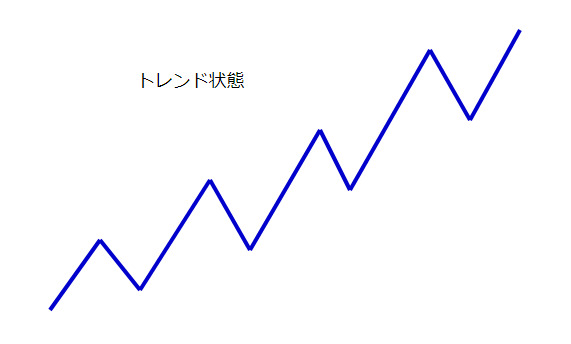
「シンプルにも程がある」といいたくなる位シンプルですが、これがトレンド状態です。ひと目見て、値動きは上昇していることが分かりますね。
“テクニカル分析”というと何だか難しそうな印象がありますが、その基礎においては、このように当たり前に思えるようなことを明確化することが大切になってきます。
この状況は、「上昇トレンド」とか「アップトレンド」とよばれ、相場の値動きが上へ上へと動いていっている状況です。
(反対に、下方向なら「下降トレンド、ダウントレンド」と呼ばれます)
値動きに方向感がない状況=「レンジ」
そして、値動きに方向感がない状況(迷っている状況)である「レンジ状態」は、下の図のようなものになります。
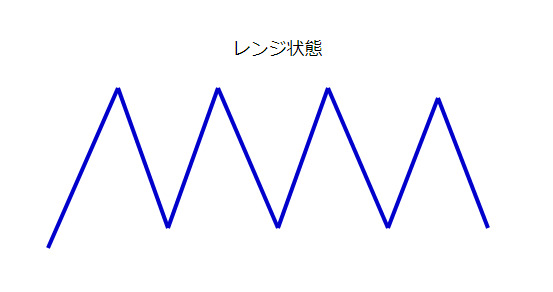
さっきのトレンド状態とは違って、同じようなところで上下に動くばかりで、「上だ」とも「下だ」ともいえない状況になっています。
「上か下か、どっちへ動こうか?」と、はっきりせずに迷っている様子がうかがえます。
こうした方向感のない状況のことを「レンジ状態」といいます。
チャートでは「トレンド」と「レンジ」が繰り返されている
「トレンド状態」と「レンジ状態」の2つのパターンというものは、トレードにおいてはチャート分析の基本中の基本といえるもので、これがFXトレードを行っていく上で重要な土台となります。
FXトレードの実践においては、まずテクニカル分析によってチャートの状況を把握し、その状況での立ち振る舞い(売るのか買うのか様子見するのか)を検討していくことからスタートします。
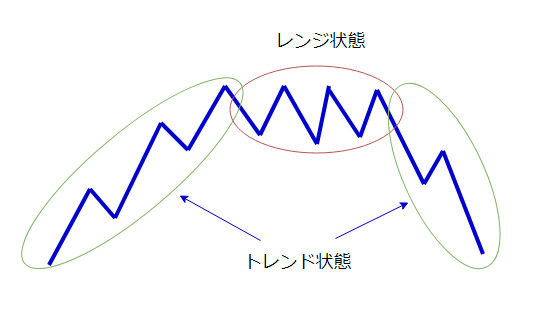
その検討をしていく上で大切な前提となるのが、「相場はトレンド状態とレンジ状態を繰り返している」という考え方です。
例えば──
トレンドからレンジになって、ふたたびトレンドになっていくケース。

レンジを経て、トレンドの方向が変わるケース。
トレンド状態から急激に反転して、トレンドの方向が変わるケース。
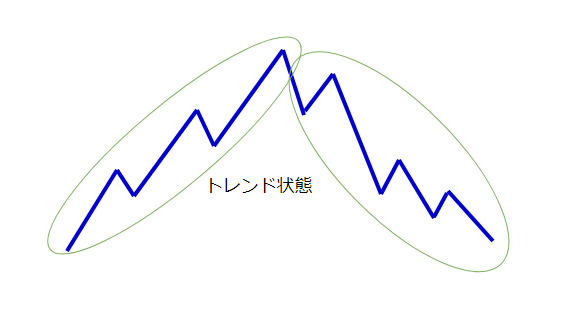
──このように相場では、トレンドとレンジの2つの状態を繰り返しているのです。
基本的なトレード戦略とは
ここまで見てきたように、相場の値動きを大きく2つのパターンに分けて把握することによって、基本的なトレード戦略というものが見えてきます。
それは次のようなものです
- 「トレンド状態」のときは、そのトレンド方向へ素直にトレードしていく。
- 「レンジ状態」のときは、方向感がなくジグザグと迷っているということなので、その動きの上限と下限からその反対側までをトレードしていく。もしくは様子見をしておく。
実際は色々なトレンドとレンジがある
しかし一口にトレンド状態といっても、そのバリエーションは多種多様であり、それによって狙うポイントや気をつけなくてはいけない場面が異なっていたりします。
レンジ状態も同様で、トレードする価値のあるレンジもあれば、無理にエントリーすべきではないレンジがあります。
また、レンジ状態には「上か下か、どちらかに抜けやすいレンジ」もあるので、多様な状況に対応していく必要があります。
このあたりのことは今後、必要に応じて詳しく解説していく予定です。
今、しっかり理解しておいて欲しいこと
今のところは、チャートの状況には「トレンドとレンジ」という、2つのパターンがあるということを覚えておいてください。
つまり、チャートはシンプルに2つの状況に分けられるということ、そしてそれを自分でも判断できるようになることが大切です。これがテクニカル分析の初歩になります。
まずは自分のFX口座のチャートやMT4をつかって、過去のチャートをふり返ってみながら、あなたの目でトレンドかレンジかを判断する練習をすることから始めてください。
疑問はあって当然。それでいい
実際に自分でチャートを見て状況を判断しようとすると、大小いろいろな疑問が出てくるはずです。
- 「どれくらい一方向へ動いたらトレンドっていうのかな?」
- 「レンジのような、トレンドのような……よく分からないなあ」
- 「大きく見たらレンジだけど、小さく見たらトレンドが行ったり来たりしてるぞ。これはレンジ?トレンド?」
こんな風に、判断に迷う場面が多々現れることでしょう。
しかし今はそういう「よく分からない」ところは、「分からない」と認た上で、とにかく自分なりに「これはどう見てもトレンドだろう」と思えるところを探してみることがポイントです。
最初の内は、限られた場面しか判断がつかないかもしれませんが、それで大丈夫です。
時間をかけて「自分なりにそう思える」という場面を少しずつ増やしていくことが、あなたのFXトレードの上達につながっていきます。
これが基礎となって、これから先、様々な状況に応じたトレード判断が可能になっていくのです。
次回予告
以上、『FX相場の状況をトレンドとレンジの2つに分類する方法とは?』という内容をお伝えしてきました。
次回は、2つの状況のうちの「トレンド状態」について、詳しく解説していきます。
テクニカル分析の強力な武器である「ダウ理論」をつかいながら、実際のトレード中にトレンド状態かどうかを把握する方法について、詳しくお伝えしていきます。
それでは、下のリンクからどうぞ。
こちらの記事もおすすめです